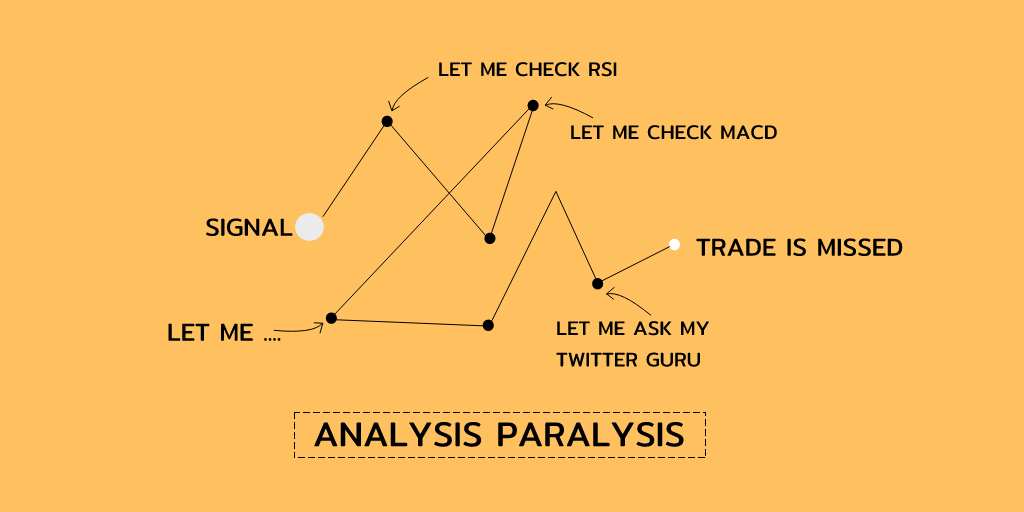
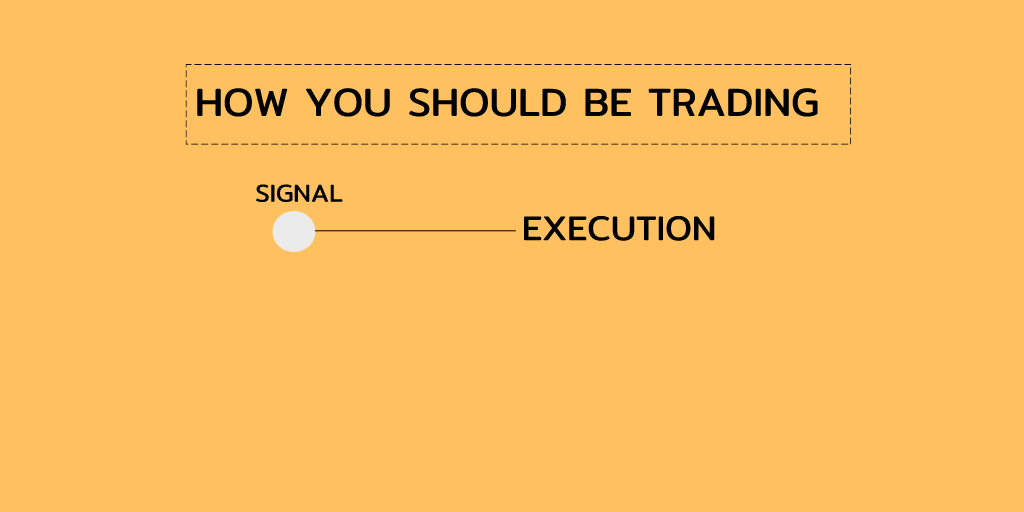
And that all three points must tested equally.
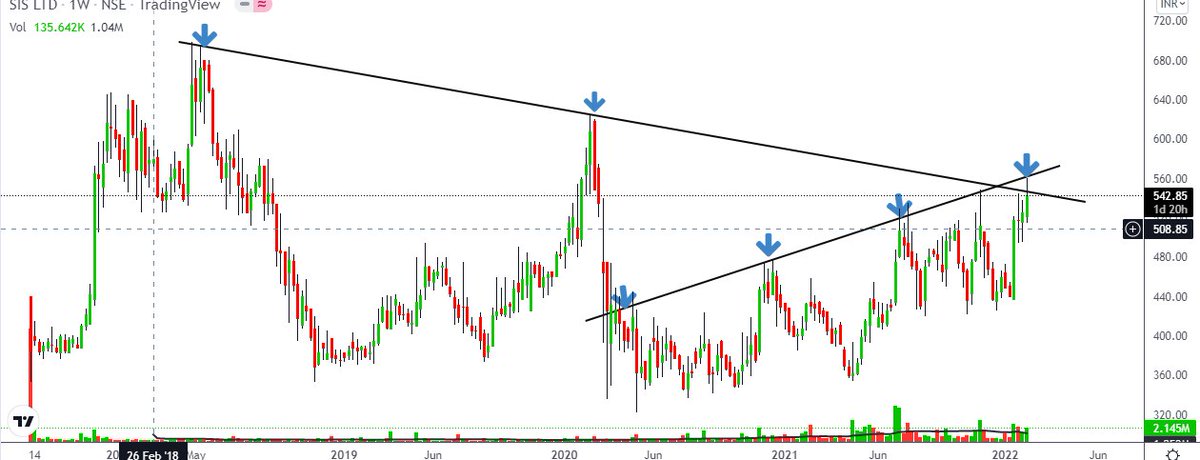
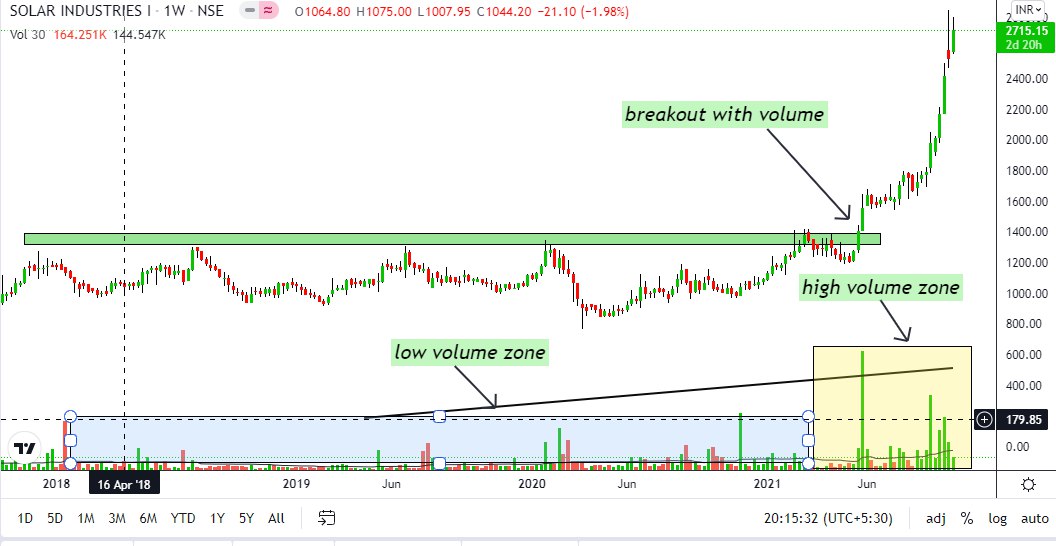
example 👇 #sis


preparing mega thread \U0001f9f5 of
— Vikrant (@Trading0secrets) October 18, 2021
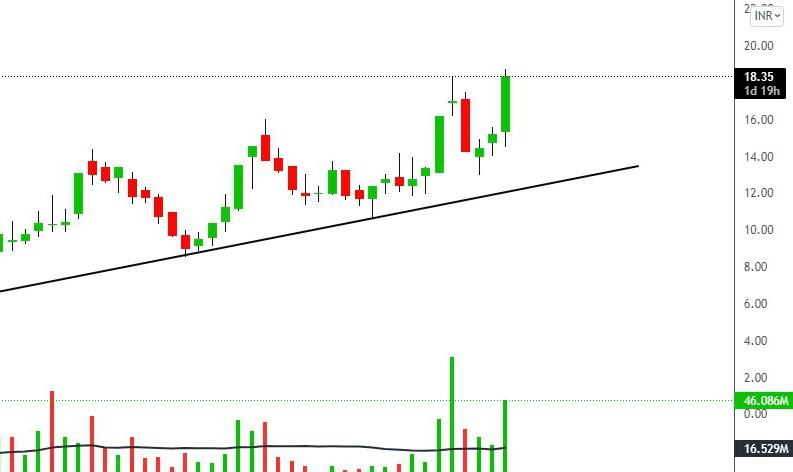
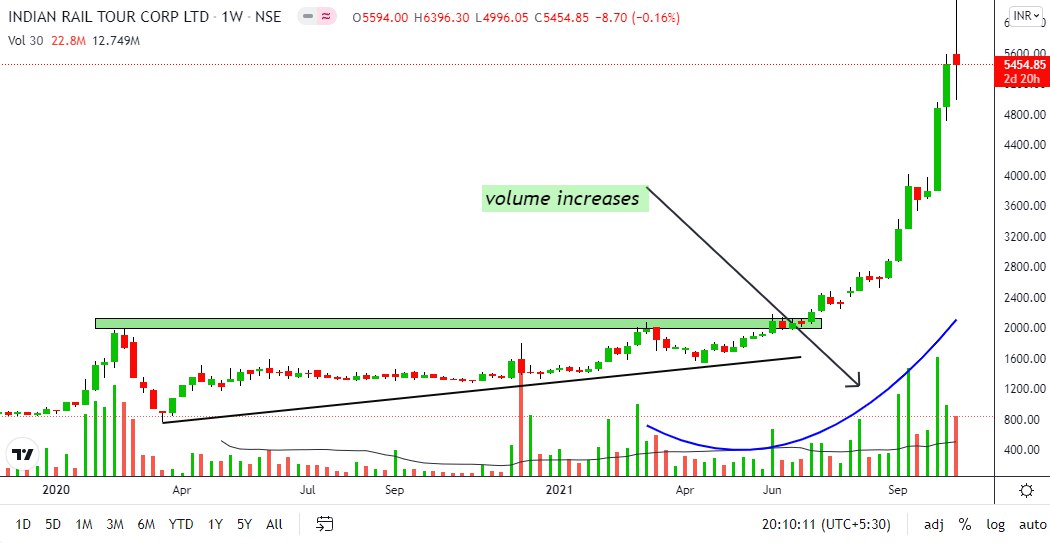
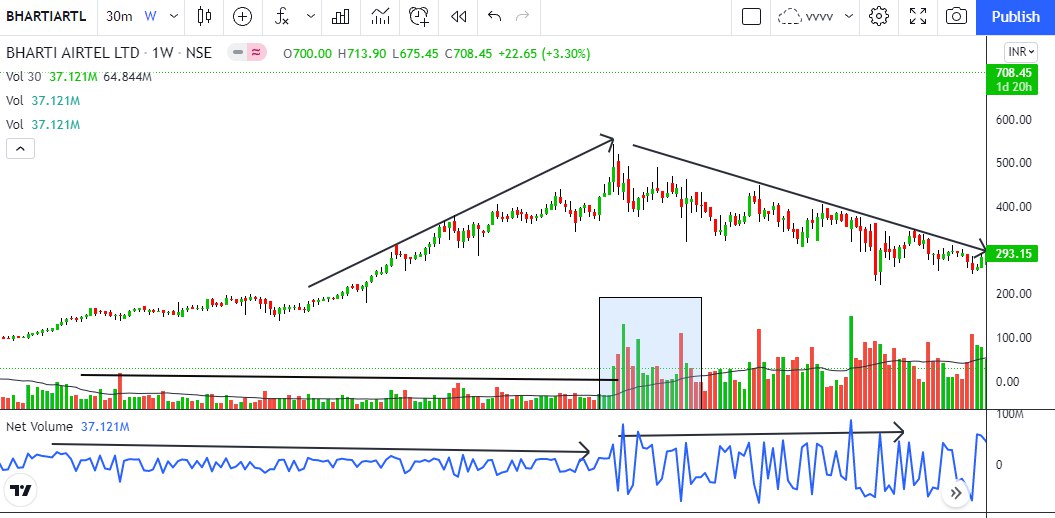
#volume analysis .
Key points \U0001f4cd
1\u20e3How should you interpret volume in different time frame?
2\u20e3how do you get that institution or big guys are accumulating ...
The full learning thread \U0001f9f5 about "VOLUME INTERPRETATION "
Stay tuned . \u0964\u0964\u0964\u0964\u0964
How I turned 7lac account to 33lac in just 1 year only by cash trading.
— Vikrant (@Trading0secrets) October 14, 2021
Soon going to make full thread about my strategy of cash by which this happened.
And for cash hedging I started option selling in different a/c.
How many of u intrested for that thread? \U0001f499\U0001f49b\U0001f499 pic.twitter.com/wIyfE8fwfw
@MiteshFan @Mitesh_Engr @Abhishekkar_ MY TRADING SETUP .... I've been using it for a long time .. result good try it \U0001f607 pic.twitter.com/XThUD0ftbl
— itrade(DJ) (@ITRADE191) June 13, 2020
Volume Should always be above 20 pic.twitter.com/CPgxLgpPKF
— itrade(DJ) (@ITRADE191) June 13, 2020
— itrade(DJ) (@ITRADE191) August 25, 2020
— itrade(DJ) (@ITRADE191) October 20, 2020
1. Let's start option selling learning.
— Mitesh Patel (@Mitesh_Engr) February 10, 2019
Strangle selling. ( I am doing mostly in weekly Bank Nifty)
When to sell? When VIX is below 15
Assume spot is at 27500
Sell 27100 PE & 27900 CE
say premium for both 50-50
If bank nifty will move in narrow range u will get profit from both.
Few are selling 20-25 Rs positional option selling course.
— Mitesh Patel (@Mitesh_Engr) November 3, 2019
Nothing big deal in that.
For selling weekly option just identify last week low and high.
Now from that low and high keep 1-1.5% distance from strike.
And sell option on both side.
1/n
Sold 29200 put and 30500 call
— Mitesh Patel (@Mitesh_Engr) April 12, 2019
Used 20% capital@44 each
Already giving more than 2% return in a week. Now I will prefer to sell 32500 call at 74 to make it strangle in equal ratio.
— Mitesh Patel (@Mitesh_Engr) February 7, 2020
To all. This is free learning for you. How to play option to make consistent return.
Stay tuned and learn it here free of cost. https://t.co/7J7LC86oW0
Ironies of Luck https://t.co/5BPWGbAxFi
— Morgan Housel (@morganhousel) March 14, 2018
"Luck is the flip side of risk. They are mirrored cousins, driven by the same thing: You are one person in a 7 billion player game, and the accidental impact of other people\u2019s actions can be more consequential than your own."
Sir, Log yahan.. 13 days patience nhi rakh sakte aur aap 2013 ki baat kar rahe ho. Even Aap Ready made portfolio banakar bhi de do to bhi wo 1 month me hi EXIT kar denge \U0001f602
— BhavinKhengarSuratGujarat (@IntradayWithBRK) September 19, 2021
Neuland 2700 se 1500 & Sequent 330 to 230 kya huwa.. 99% retailers/investors twitter par charcha n EXIT\U0001f602