
(5 major banks 🏦 - #hdfcbank #icicibank #kotakbank #sbi #axisbank)
Option selling strategy thread 🧵
*Capital must be above 6lac
*Target only banknifty (weekly expiry)
* Target 1/2% per week
* combine premium should above 100
Two types of strategy normally i use
⚡ directional
⚡Non directional (strangle)
(5 major banks 🏦 - #hdfcbank #icicibank #kotakbank #sbi #axisbank)
Then mark swing low of #banknifty & start selling 200 points down strike puts and add more at support line.
If swing support broken then exit.
(Trending upmove)
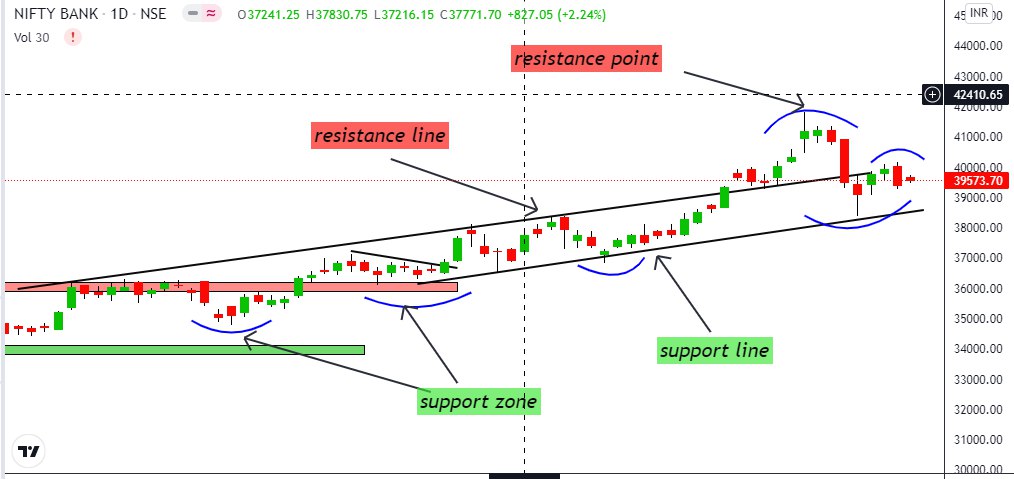
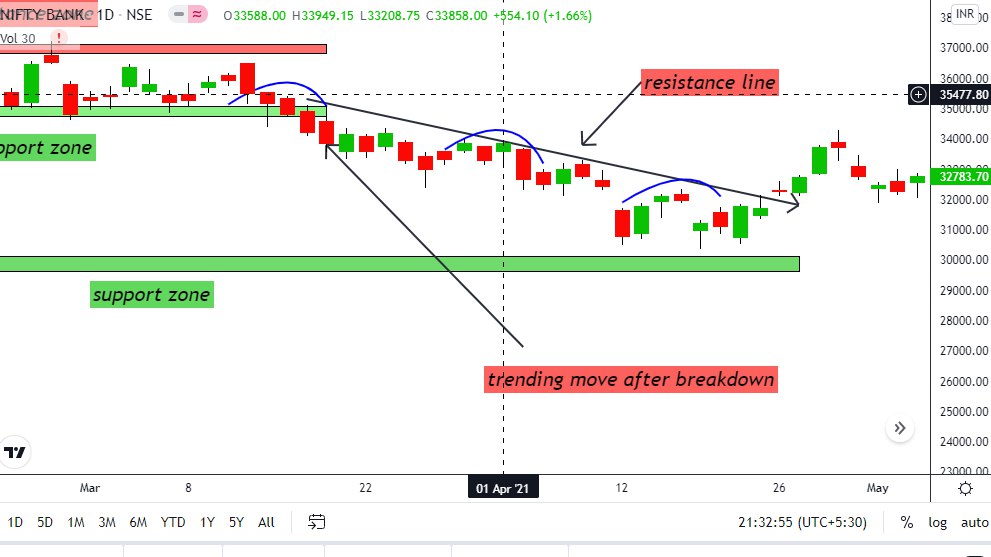
Mark it's swing high & start selling its 200 points above call .
If swing resistance broken then exit .
Selling 200 points above calls of resistance zone & selling 200 points below puts of support zone.
When ever support & resistance break exit position .
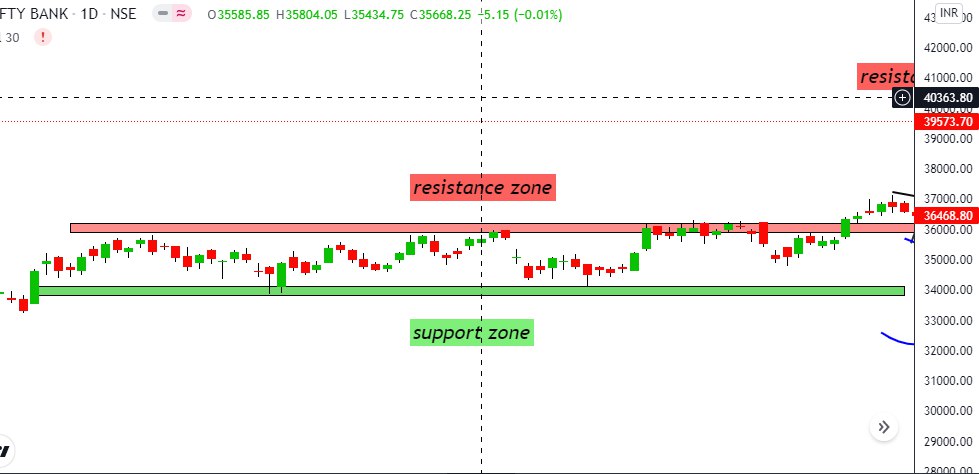
& if range is far more away you can also select range in 2 hours chart .
70% of time #banknifty is range bound

I m sharing it very simply so that everyone could understand option selling easily.
@Mitesh_Engr
@AdityaTodmal
More from Vikrant


I really love ❤ every tweet of @markminervini sir
But out them 5 are incredible 👍
Which are also summary of his book.
Here are that five 5⃣ tweets 👇
https://t.co/vKMVxF137t
https://t.co/nGrDHlRkuA
https://t.co/8DtxnJf0Bo
https://t.co/ROihOUjesI
But out them 5 are incredible 👍
Which are also summary of his book.
Here are that five 5⃣ tweets 👇
https://t.co/vKMVxF137t
Ignore the naysayers. They will always be here and they will always be skeptical of your dreams and try to discourage you. Success is the best revenge. And now I'll hear the excuses for my 2021 USIC performance as well. LOL! pic.twitter.com/2hziplVEzf
— Mark Minervini (@markminervini) September 29, 2021
https://t.co/nGrDHlRkuA
Rules I built a 38-year career on...
— Mark Minervini (@markminervini) December 23, 2021
1. always use a stop loss
2. define your stop before you enter
3. never risk more than you expect to gain
4. nail down decent profits
5. never let a good size gain turn into a loss
6. never average down
7. never get bold when running cold
https://t.co/8DtxnJf0Bo
If you want to make great returns consistently and do it w/ minimal drawdown, you must get off the idea of being right or wrong and instead learn how to lose much less when you're wrong than you make when you're right. I'm wrong just as much as I'm right. That's why I use stops.
— Mark Minervini (@markminervini) July 20, 2021
https://t.co/ROihOUjesI
I dedicated 37 years to learning and perfecting the craft of stock trading. If there was a way around risk management, I probably would have found it. PhDs, Nobel prize winners and geniuses haven't been able to do it. Your losses must be managed smaller than your gains.. period.
— Mark Minervini (@markminervini) July 5, 2021
More from Equity
Trading view scanner process -
1 - open trading view in your browser and select stock scanner in left corner down side .
2 - touch the percentage% gain change ( and u can see higest gainer of today)
3. Then, start with 6% gainer to 20% gainer and look charts of everyone in daily Timeframe . (For fno selection u can choose 1% to 4% )
4. Then manually select the stocks which are going to give all time high BO or 52 high BO or already given.
5. U can also select those stocks which are going to give range breakout or already given range BO
6 . If in 15 min chart📊 any stock sustaing near BO zone or after BO then select it on your watchlist
7 . Now next day if any stock show momentum u can take trade in it with RM
This looks very easy & simple but,
U will amazed to see it's result if you follow proper risk management.
I did 4x my capital by trading in only momentum stocks.
I will keep sharing such learning thread 🧵 for you 🙏💞🙏
Keep learning / keep sharing 🙏
@AdityaTodmal
1 - open trading view in your browser and select stock scanner in left corner down side .
2 - touch the percentage% gain change ( and u can see higest gainer of today)
Making thread \U0001f9f5 on trading view scanner by which you can select intraday and btst stocks .
— Vikrant (@Trading0secrets) October 22, 2021
In just few hours (Without any watchlist)
Some manual efforts u have to put on it.
Soon going to share the process with u whenever it will be ready .
"How's the josh?"guys \U0001f57a\U0001f3b7\U0001f483
3. Then, start with 6% gainer to 20% gainer and look charts of everyone in daily Timeframe . (For fno selection u can choose 1% to 4% )
4. Then manually select the stocks which are going to give all time high BO or 52 high BO or already given.
5. U can also select those stocks which are going to give range breakout or already given range BO
6 . If in 15 min chart📊 any stock sustaing near BO zone or after BO then select it on your watchlist
7 . Now next day if any stock show momentum u can take trade in it with RM
This looks very easy & simple but,
U will amazed to see it's result if you follow proper risk management.
I did 4x my capital by trading in only momentum stocks.
I will keep sharing such learning thread 🧵 for you 🙏💞🙏
Keep learning / keep sharing 🙏
@AdityaTodmal


You May Also Like


Moderna CEO Stephane Bancel was previously CEO of bioMerieux in France from 07-10.
Alain Merieux, who owns bioMerieux, was instrumental in the creation of the Wuhan Institute of Virology P4 Lab.
The same people who helped create the virus, also helped to create the vaccines...
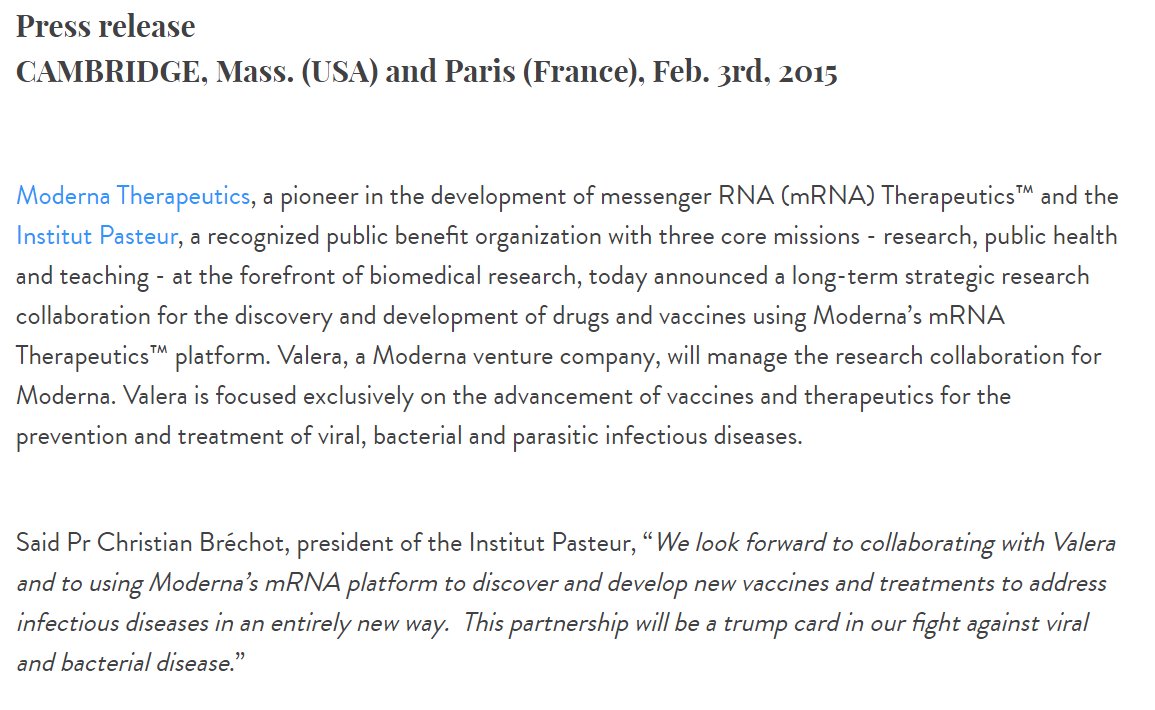
Moderna partnered with French Pasteur Institute in 2015 to develop mRNA vaccine technology.
Pasteur Institute partnered with the Wuhan P4 Laboratory in 2017 along with the Merieux Foundation to study emerging viruses...
https://t.co/yFsHwrNYaK
https://t.co/9M5lydBKhM
Nobel prize winning scientist Luc Montagnier asserts that Sars-Cov-2 is man-made and originated from the Wuhan Institute of Virology.
Montagnier did extensive work with the Pasteur Institute in France which was partnered with the Wuhan P4.
Merieux Foundation & the Chinese government have worked together since 1965, and partnered to study emerging pathogens in Africa in 2015.
Their research included "PATHOGENS CARRIED BY BATS" that provoke respiratory diseases.
🚨🚨🚨
https://t.co/gVwpT0ssqI

Alain Merieux, who owns bioMerieux, was instrumental in the creation of the Wuhan Institute of Virology P4 Lab.
The same people who helped create the virus, also helped to create the vaccines...
Moderna partnered with French Pasteur Institute in 2015 to develop mRNA vaccine technology.
Pasteur Institute partnered with the Wuhan P4 Laboratory in 2017 along with the Merieux Foundation to study emerging viruses...
https://t.co/yFsHwrNYaK
https://t.co/9M5lydBKhM
Nobel prize winning scientist Luc Montagnier asserts that Sars-Cov-2 is man-made and originated from the Wuhan Institute of Virology.
Montagnier did extensive work with the Pasteur Institute in France which was partnered with the Wuhan P4.
Merieux Foundation & the Chinese government have worked together since 1965, and partnered to study emerging pathogens in Africa in 2015.
Their research included "PATHOGENS CARRIED BY BATS" that provoke respiratory diseases.
🚨🚨🚨
https://t.co/gVwpT0ssqI
