In this Video I have discussed about Mean Reversion Intraday Trading Strategy
More from JayneshKasliwal
Criteria
Screener to Find Swing Stocks.
1. 15% Range of Near 52 week high
2. Avg Volume > 1 lakh
3. Market Cap > 2000 Cr
4. Roe Roce > 20%
5. Eps Increasing Qtr on Qtr
6. Above 50 ema
1/
How to use This Screener
1. Basically we are screening Fundamentally strong stock
2. These are Technically Strong also as stocks are near 52 week high and above 50 ema
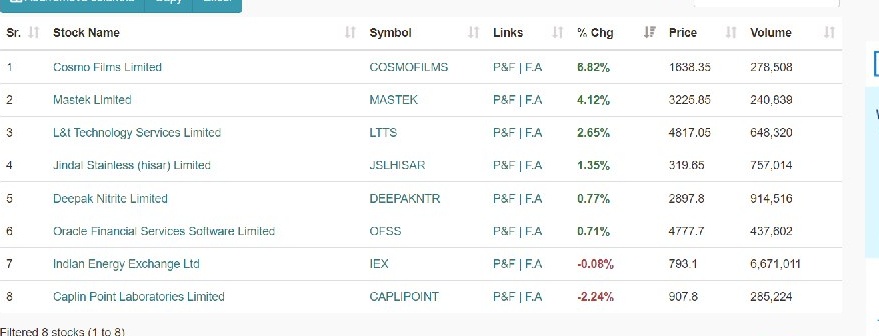
3. Below is the list For the screened Stocks.
4. Target should be on RR
@StocksNerd @MarketScientist
2/
When to Enter
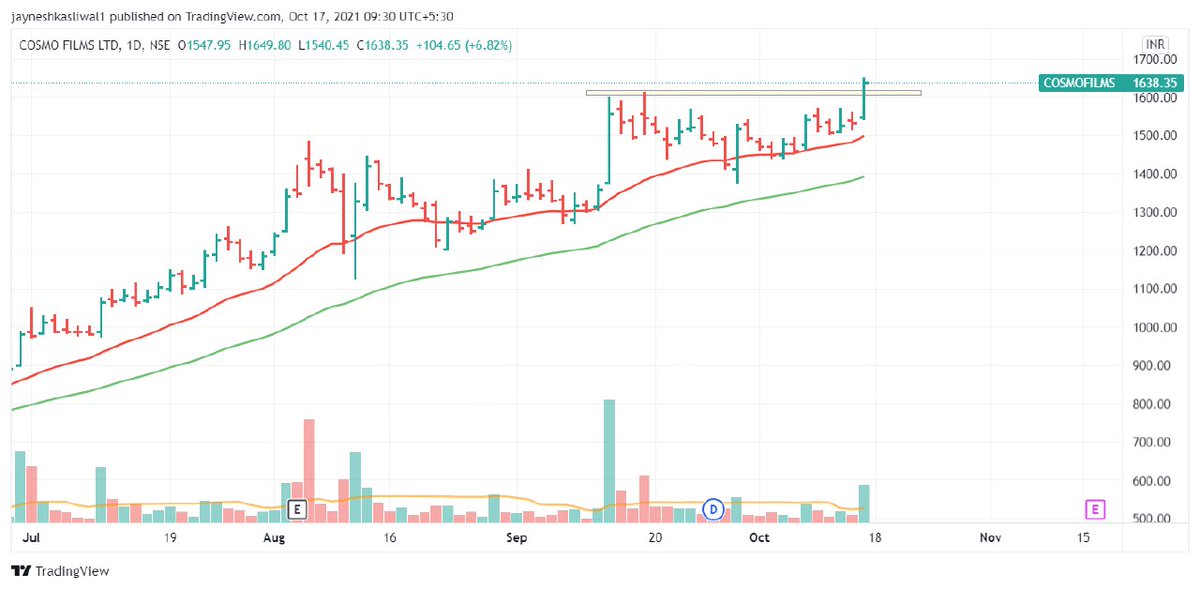
1. When 52 week High is Broken
2. Filter Stocks Select Stock With High Relative Strength
Example : #CosmoFilms , #Mastek
3. Keep Sl Below 21 ema
4. Keep Trailing Using 21 ema
5. Enter stocks on high volume breakout
6.Look for Price Range Contraction
3.
Your Most work is done by the screener
The most important task is filtering out manually and that's where your Returns will differ
As we are screening TechnoFunda stocks these can used for momentum investing
Join telegram https://t.co/b4N4oPAto9
@AmitabhJha3 @chartians
🧵 Thread 🧵
[1/15]
𝗖𝗵𝗮𝗿𝘁𝗶𝗻𝗸 𝗦𝗰𝗿𝗲𝗲𝗻𝗲𝗿 is a Stock screening tool that is useful to screen stocks based on Technical & Fundamentals.
🔸 It scans stocks by using technical indicators like RSI, MACD, divergences, etc.
🔸 It also uses fundamental tools like Book Value, EPS,PE etc
[2/15]
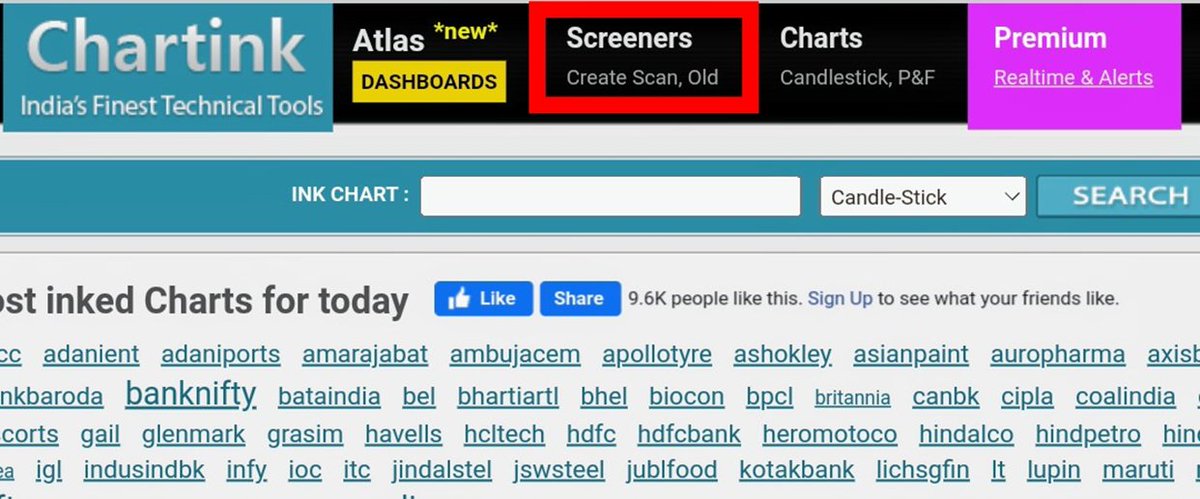
How To Create A Scan ?
Go to https://t.co/JJEJBg3Cd8 & click on 𝘊𝘳𝘦𝘢𝘵𝘦 𝘚𝘤𝘢𝘯 under 𝘚𝘤𝘳𝘦𝘦𝘯𝘦𝘳𝘴.
[3/15]
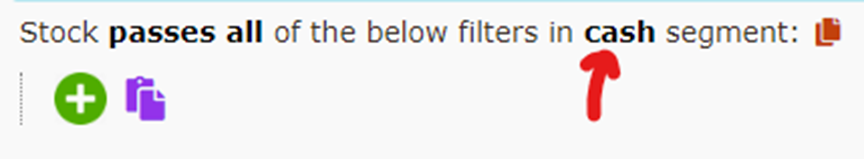
𝗙𝗶𝗿𝘀𝘁 𝗦𝘁𝗲𝗽 𝗧𝗼 𝗙𝗶𝗹𝘁𝗲𝗿 𝗦𝘁𝗼𝗰𝗸𝘀
We can select segments of stocks of our choice, e.g. cash or futures stocks, Nifty 100 etc.
Click on green ‘+’ icon to add conditions.
[4/15]
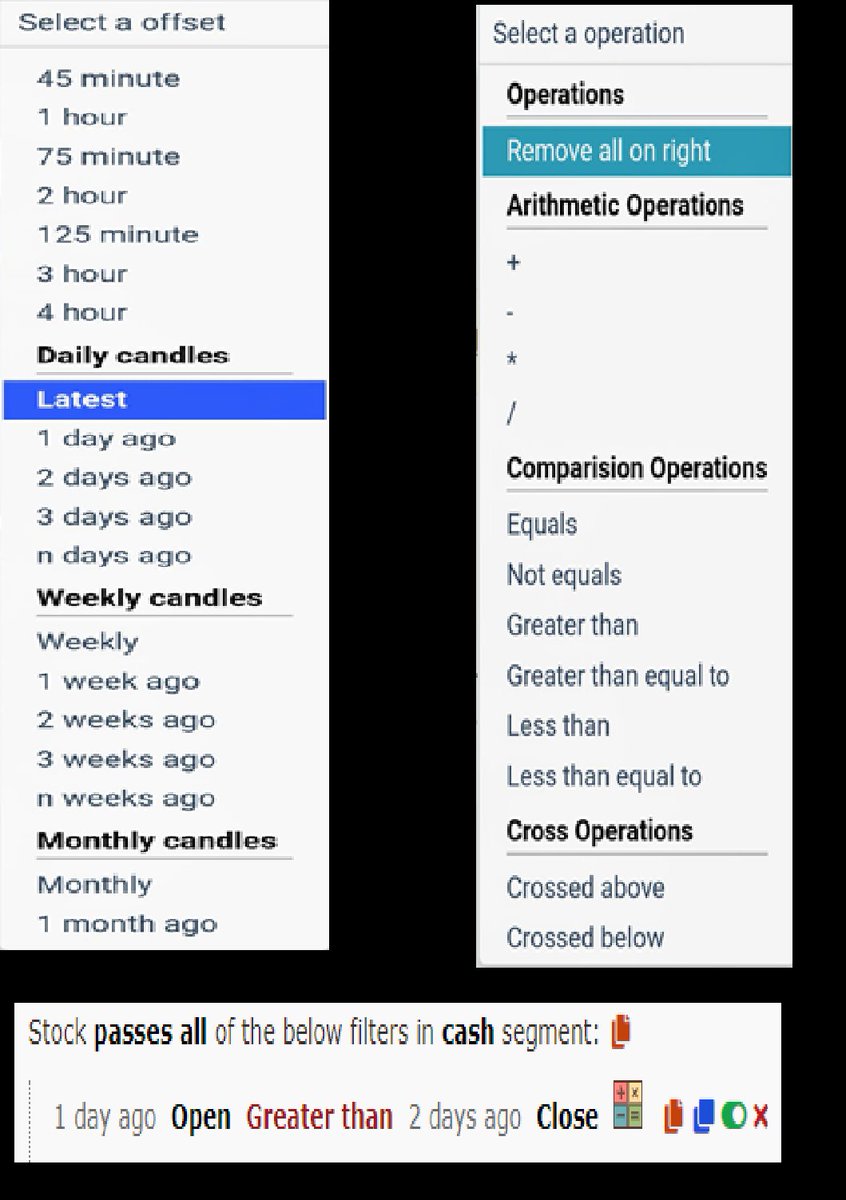
𝗖𝗮𝗻𝗱𝗹𝗲 𝗧𝗶𝗺𝗲𝗳𝗿𝗮𝗺𝗲𝘀 & 𝗖𝗼𝗺𝗽𝗮𝗿𝗶𝘀𝗼𝗻 𝗢𝗽𝗲𝗿𝗮𝘁𝗼𝗿𝘀🔸 We can select any timeframe of candles in Chartink, from minutes to years.
🔸 And compare two candles using comparison operators like 𝘌𝘲𝘶𝘢𝘭 𝘵𝘰 or 𝘎𝘳𝘦𝘢𝘵𝘦𝘳 𝘛𝘩𝘢𝘯 , crossovers etc
[5/15]


𝗣𝗮𝗿𝘁 𝟮
🧵 Thread 🧵
Retweet And I will Link a 36 Page PDF
𝟭. 𝗔𝗱𝗱 𝗙𝘂𝗻𝗱𝗮𝗺𝗲𝗻𝘁𝗮𝗹𝘀 𝗼𝗻 𝗰𝗵𝗮𝗿𝘁
🔸 Link:
https://t.co/HcIXT7V002
🔸 Click on the above link -> Add to Favourites -> Add on Chart from favourites and start using it !
2/20
You can add financials from many fundamental criteria's like
🔸 Cashflows
🔸 Income Statements
🔸 Balance sheets
🔸 PE,PB ratios
🔸 Marketcapitlization
🔸 Statistics
3/20
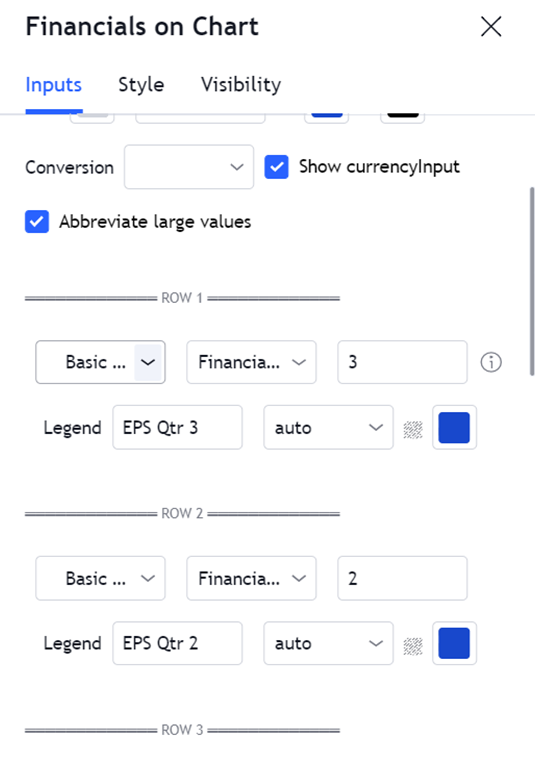
How to change Settings:
🔸 There are 8 columns you can basically select any financial you want
🔸 You can select quarterly or Yearly values and can also write
🔸 The names of the financiaLS Example : EPS Qtr3
🔸 You can Change colours , font size
4/20
𝟮. 𝗜𝗻𝗱𝗶𝗰𝗮𝘁𝗼𝗿 𝗥𝗮𝘁𝗶𝗻𝗴𝘀
You cannot track each and every indicator like ( 𝗠𝗼𝘃𝗶𝗻𝗴 𝗔𝘃𝗴𝘀 , 𝗥𝗦𝗜 , 𝗠𝗔𝗖𝗗 ) etc , you can use plot this custom strategy to understand whether the trend is positive or negative of those indicators
5/20
More from Trading strategies

Hello!! 👋
• I have curated some of the best tweets from the best traders we know of.
• Making one master thread and will keep posting all my threads under this.
• Go through this for super learning/value totally free of cost! 😃
1. 7 FREE OPTION TRADING COURSES FOR
A THREAD:
— Aditya Todmal (@AdityaTodmal) November 28, 2020
7 FREE OPTION TRADING COURSES FOR BEGINNERS.
Been getting lot of dm's from people telling me they want to learn option trading and need some recommendations.
Here I'm listing the resources every beginner should go through to shorten their learning curve.
(1/10)
2. THE ABSOLUTE BEST 15 SCANNERS EXPERTS ARE USING
Got these scanners from the following accounts:
1. @Pathik_Trader
2. @sanjufunda
3. @sanstocktrader
4. @SouravSenguptaI
5. @Rishikesh_ADX
The absolute best 15 scanners which experts are using.
— Aditya Todmal (@AdityaTodmal) January 29, 2021
Got these scanners from the following accounts:
1. @Pathik_Trader
2. @sanjufunda
3. @sanstocktrader
4. @SouravSenguptaI
5. @Rishikesh_ADX
Share for the benefit of everyone.
3. 12 TRADING SETUPS which experts are using.
These setups I found from the following 4 accounts:
1. @Pathik_Trader
2. @sourabhsiso19
3. @ITRADE191
4.
12 TRADING SETUPS which experts are using.
— Aditya Todmal (@AdityaTodmal) February 7, 2021
These setups I found from the following 4 accounts:
1. @Pathik_Trader
2. @sourabhsiso19
3. @ITRADE191
4. @DillikiBiili
Share for the benefit of everyone.
4. Curated tweets on HOW TO SELL STRADDLES.
Everything covered in this thread.
1. Management
2. How to initiate
3. When to exit straddles
4. Examples
5. Videos on
Curated tweets on How to Sell Straddles
— Aditya Todmal (@AdityaTodmal) February 21, 2021
Everything covered in this thread.
1. Management
2. How to initiate
3. When to exit straddles
4. Examples
5. Videos on Straddles
Share if you find this knowledgeable for the benefit of others.


(a thread) 🧵
>Do retweet if it adds value as this took a long time for me to make
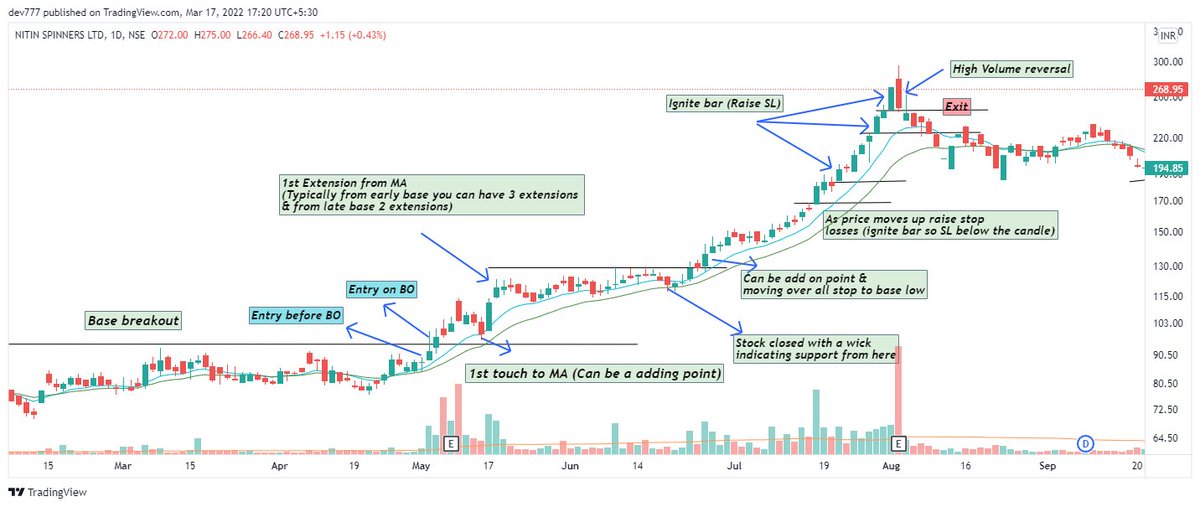
1) 10/20 Day EMA -
Enter the stock as it comes up back to the 10/20 day EMA and ride it till it drops below or SL hits as explained below
Eg -Nitin Spinners as below
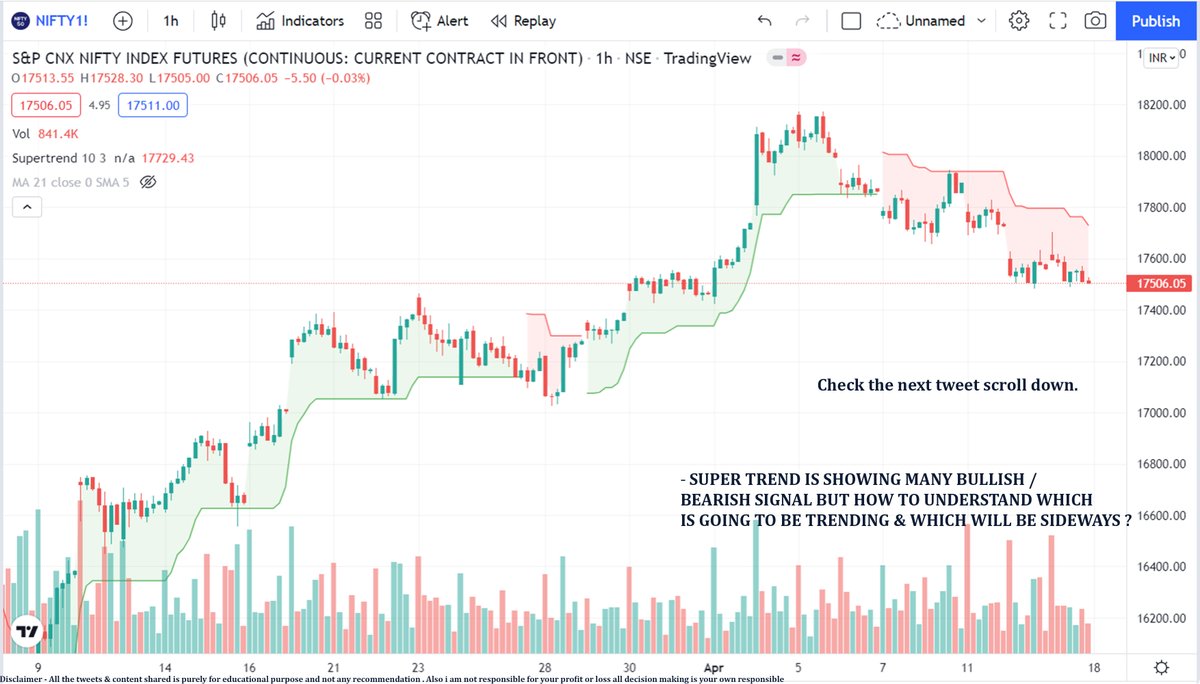
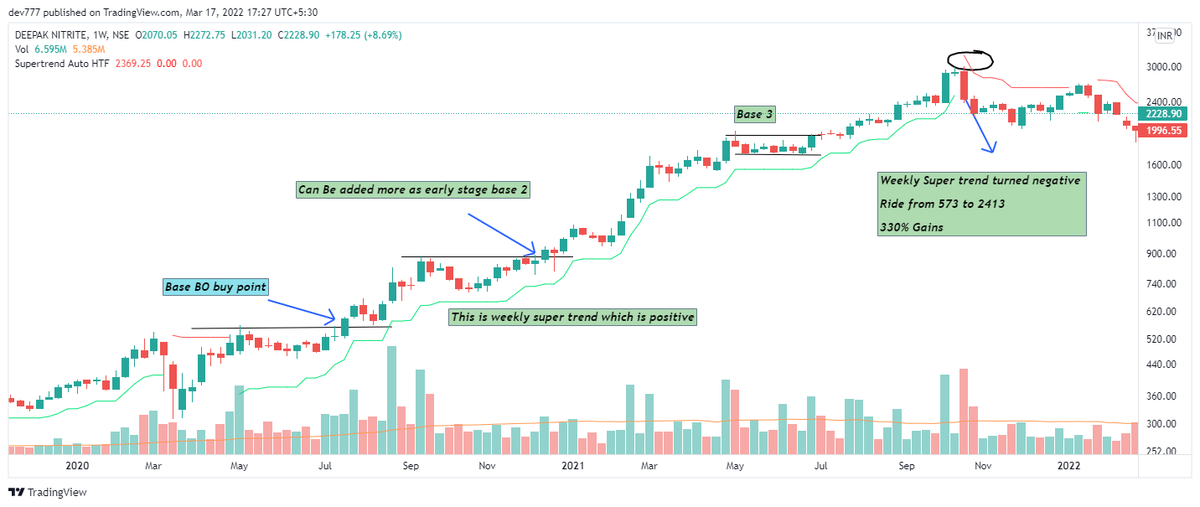
2) Weekly Super trend (Setting 2,7): Whenever trend changes , volatility increases & supertrend measures volatility..That's the logic behind it
Eg - Deepak Nitrite
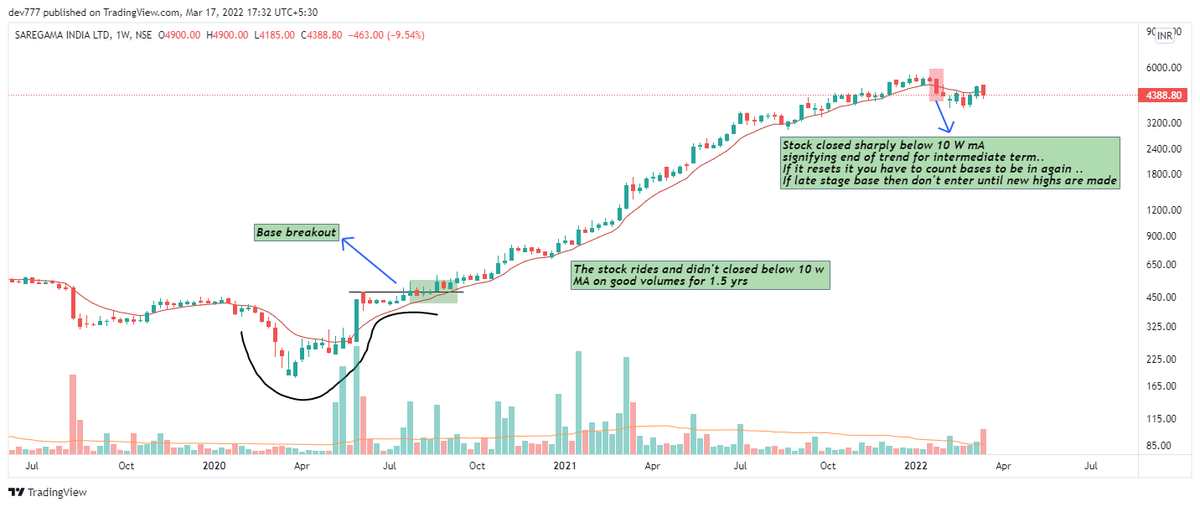
3) 10 Week MA : Trend following can be done using 10 w MA
Eg - Saregama
Fundamental analysis has to be done for best results as these are to be applied on a growing co + sector movt together ..Eg If you will apply to random co with low RS or low growth..This might be very choppy
Do retweet if make sense so as I can make more of such thread
Join telegram group for stock analysis & daily updates
https://t.co/lJ00OKEVd2
Download equialpha app for free momentum basics course
https://t.co/9N7vFDorC8
Thanks for reading.. Do like
A Mega Thread🧵
Concepts :
Relative Strength
Stage Analysis
Retweet and Comment If you want to attend a live session on the same !

We have Got around 86 Stocks that became 5X in 2 years
These Belonged to various sectors and Groups
Excel Link for List of Stocks
https://t.co/jESOUM32b5
1/n
All stocks had few things in common :
Stocks doubled Before entering into Stage 2 Uptrend
52 week RS was positive in stage 2
90% stocks even gave all time high breakout after Stage 2
60 Stocks had market cap less than 1000 Cr
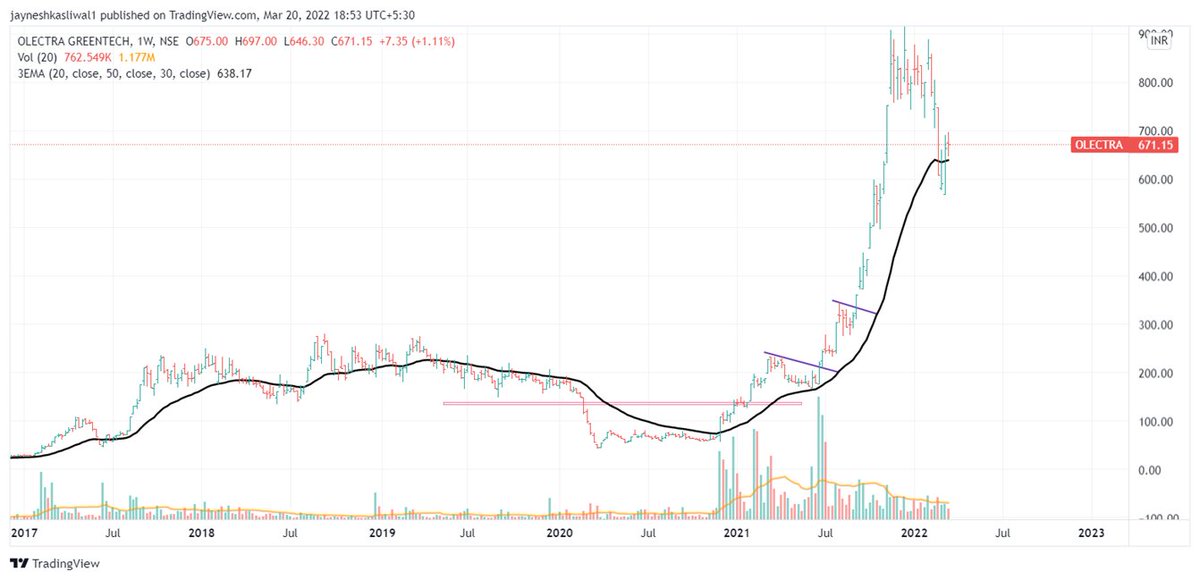
Examples : OLECTRA , PGEL
2/n
So What is Relative Strength ?
Relative strength is a strategy used in momentum investing and in identifying value stocks.
It focuses on investing in stocks or other investments that have performed well relative to the market as a whole or to a relevant benchmark.
3/n
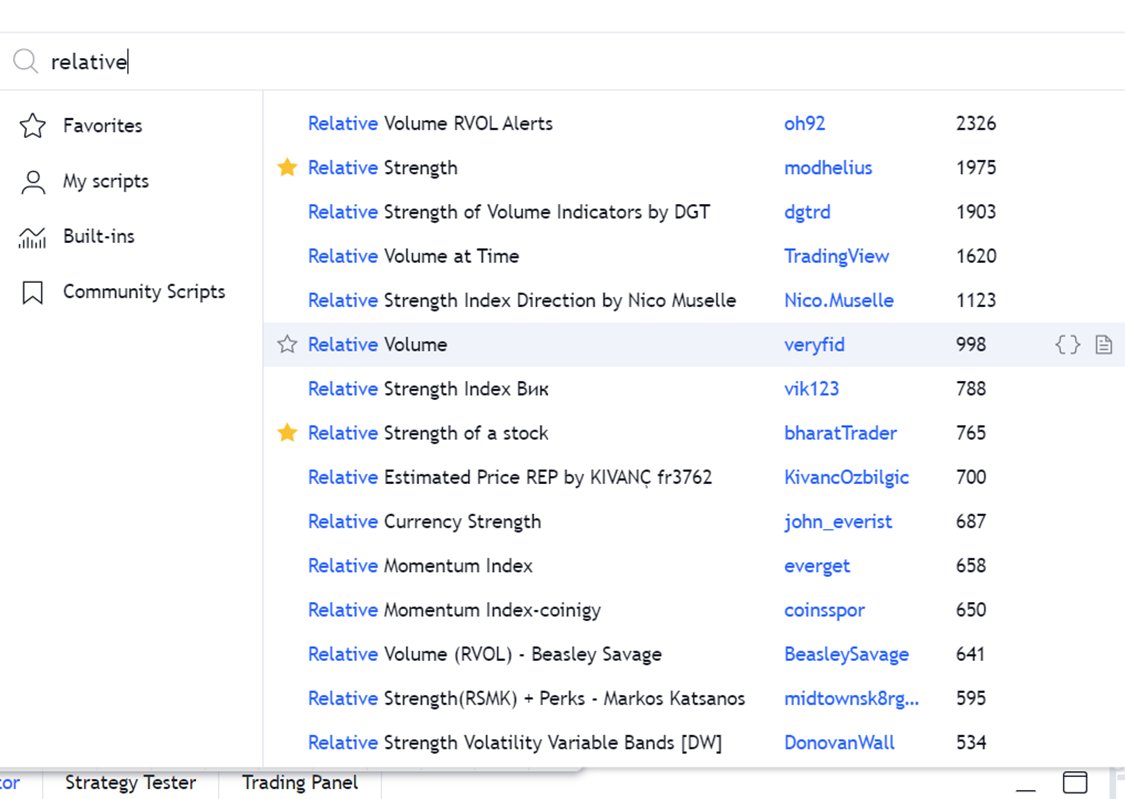
How to Apply ?
Type
“Relative Strength”
Choose any
By bharattrader
By traderlion
By Modhelius
I use by bharattrader
In setting use 52 period
Use Weekly Chart
4/n