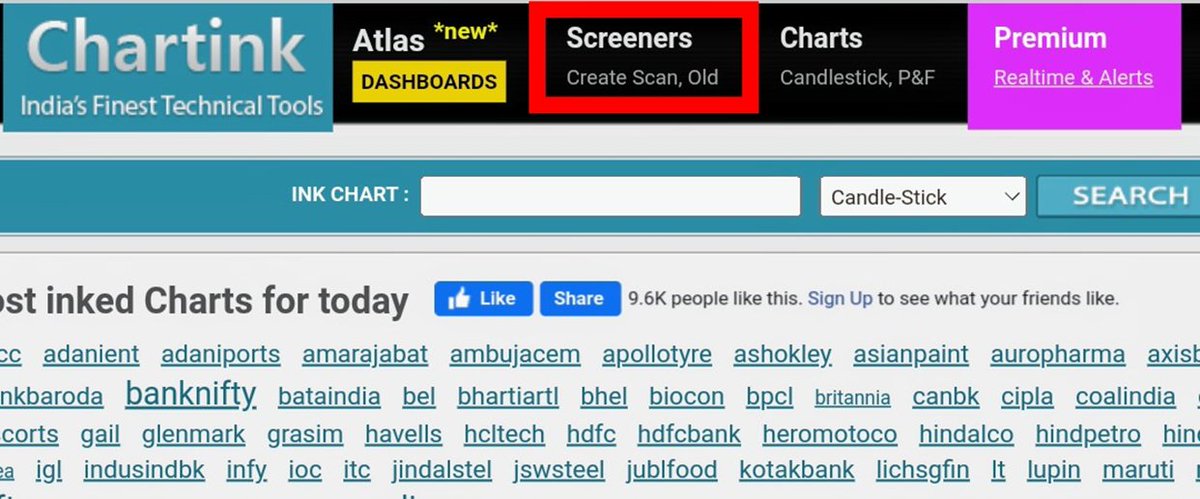
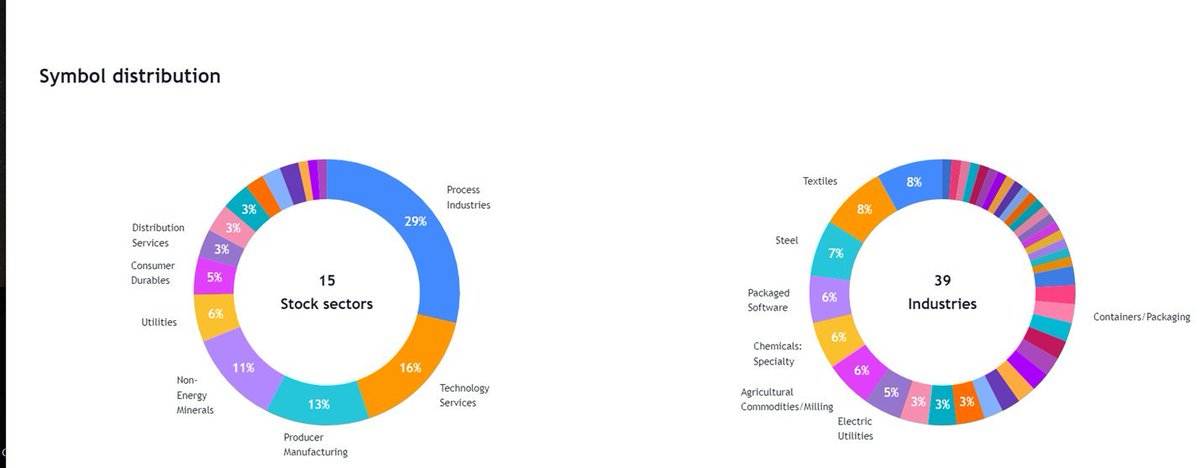
🔸 It scans stocks by using technical indicators like RSI, MACD, divergences, etc.
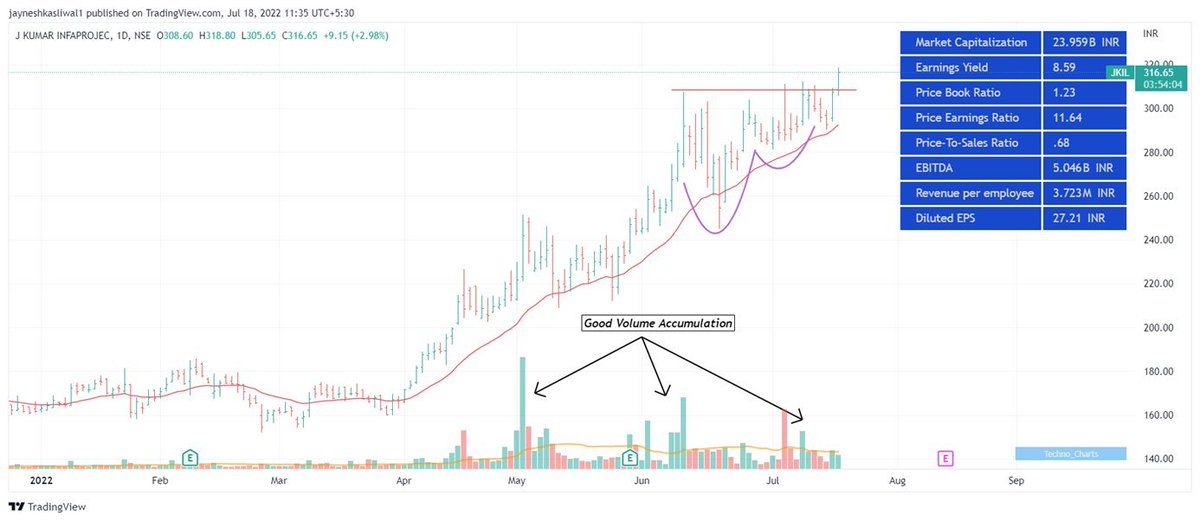
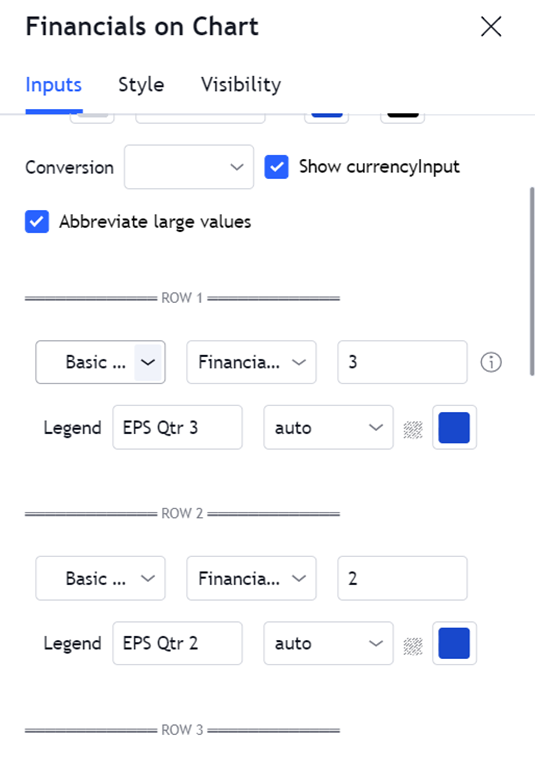
🔸 It also uses fundamental tools like Book Value, EPS,PE etc
[2/15]
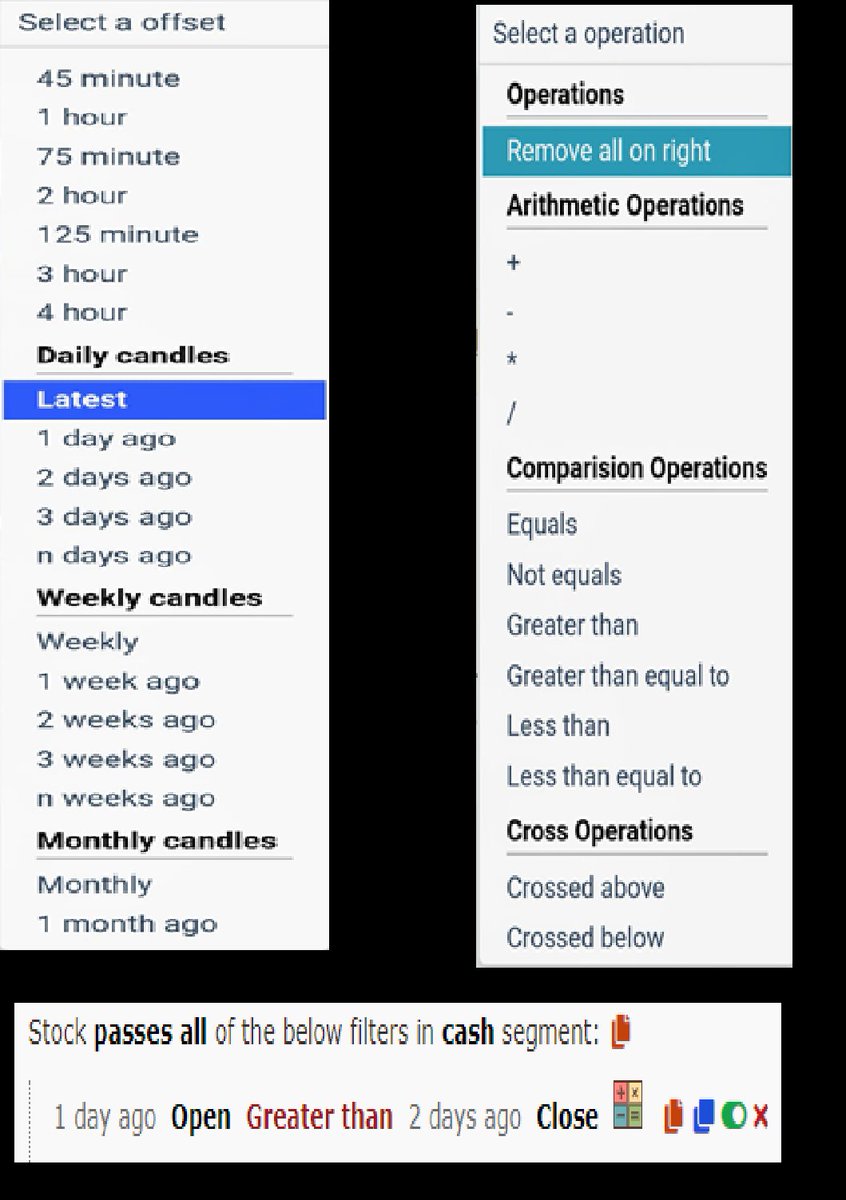


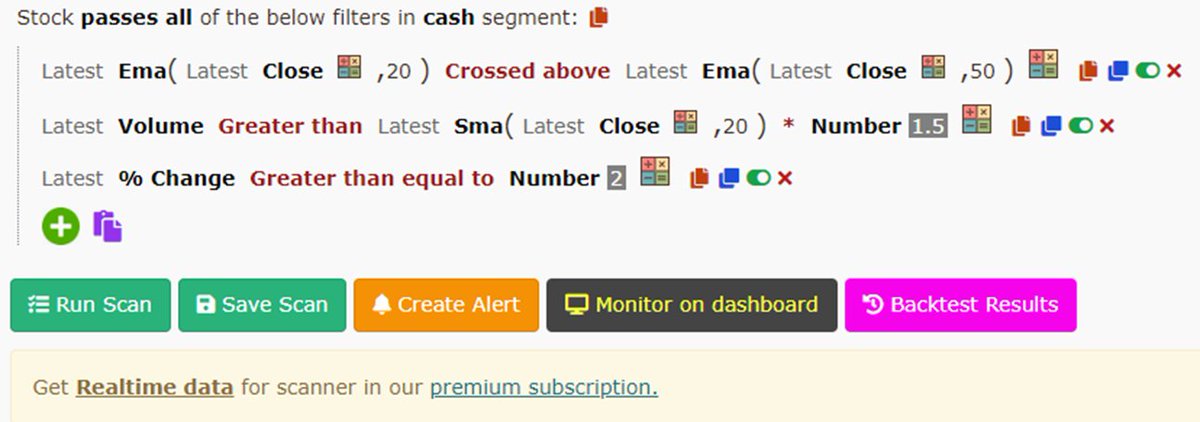


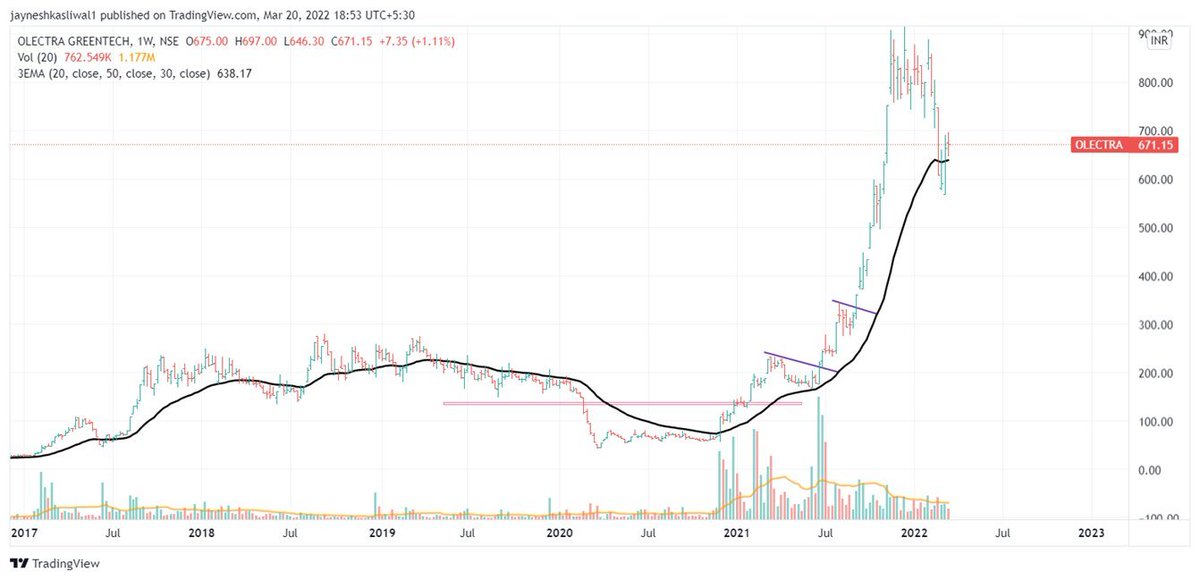
\U0001d5db\U0001d5fc\U0001d604 \U0001d601\U0001d5fc \U0001d5f0\U0001d5ff\U0001d5f2\U0001d5ee\U0001d601\U0001d5f2 \U0001d606\U0001d5fc\U0001d602\U0001d5ff \U0001d5fc\U0001d604\U0001d5fb \U0001d5d6\U0001d5f5\U0001d5ee\U0001d5ff\U0001d601\U0001d5f6\U0001d5fb\U0001d5f8 \U0001d5e6\U0001d5f0\U0001d5ff\U0001d5f2\U0001d5f2\U0001d5fb\U0001d5f2\U0001d5ff
— JayneshKasliwal (@JayneshKasliwal) August 25, 2022
\U0001f9f5 Thread \U0001f9f5
[1/15]
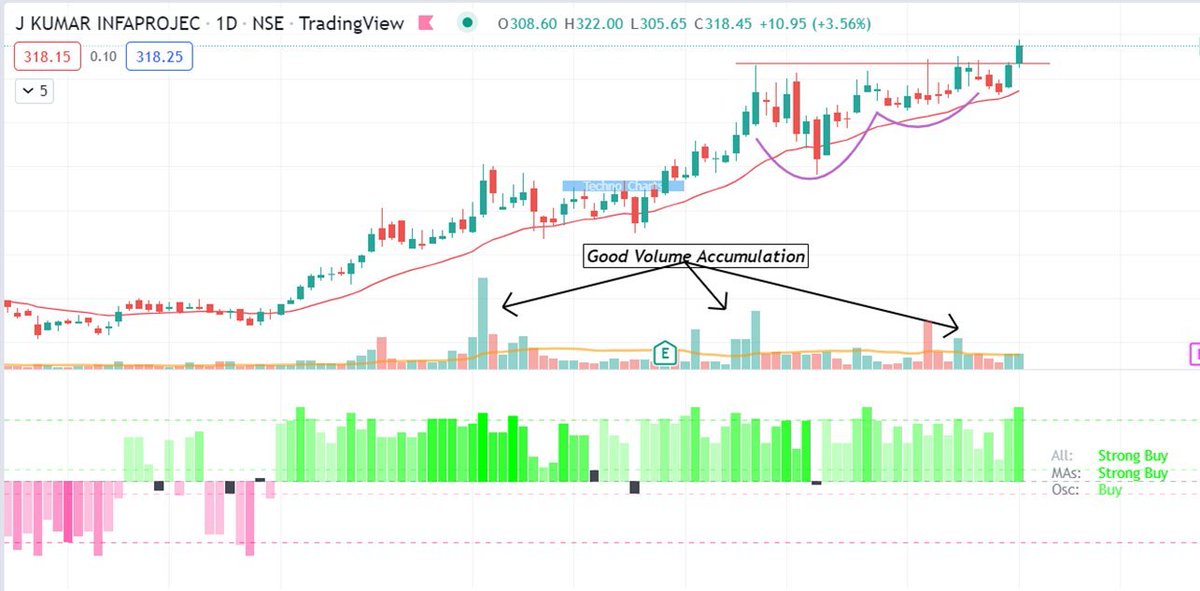


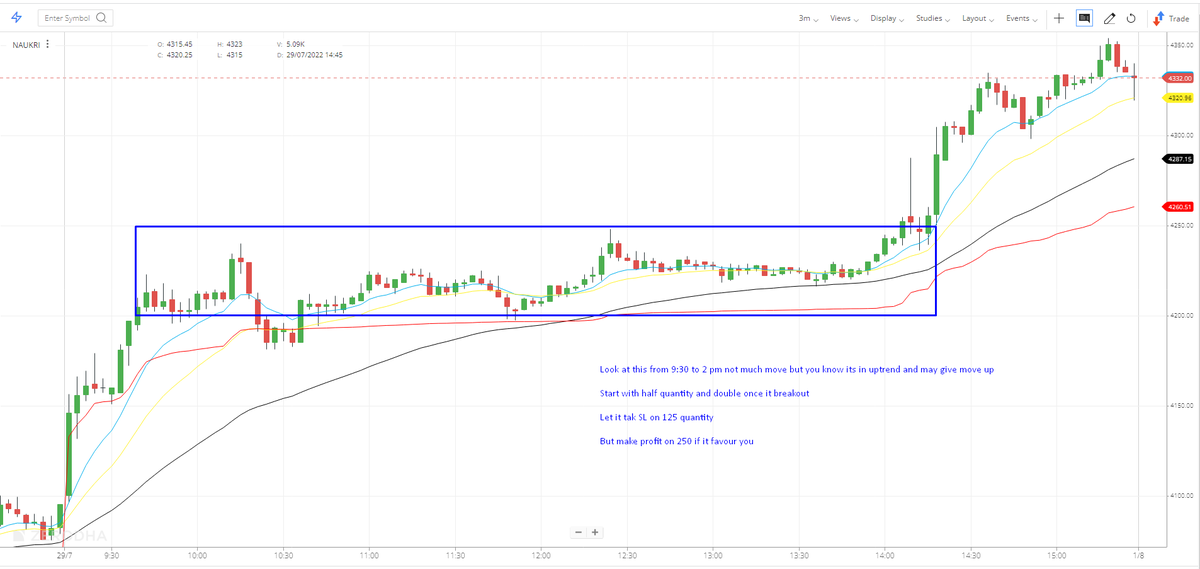
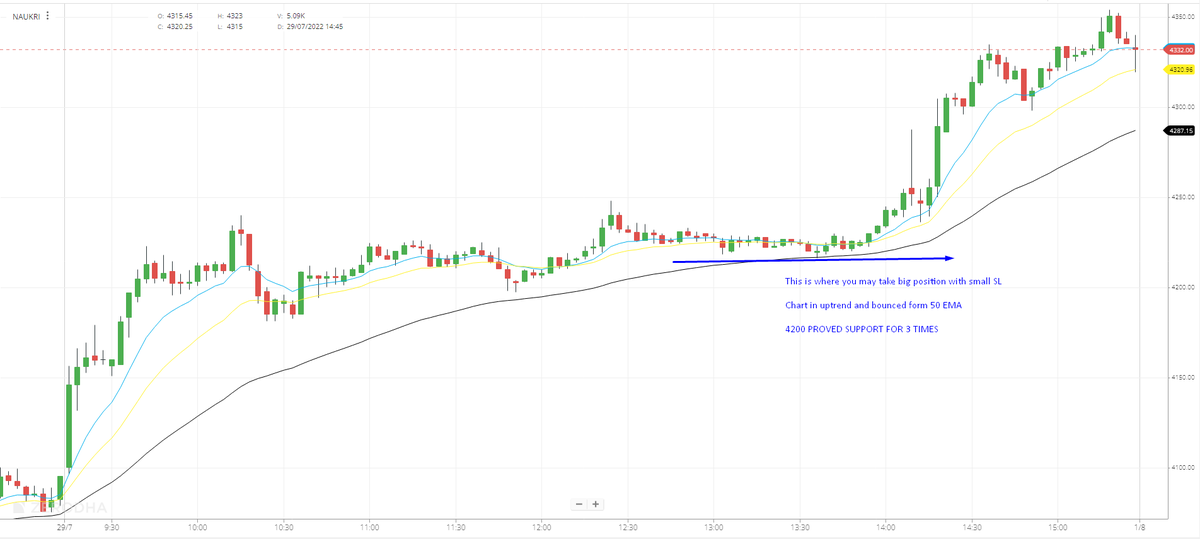
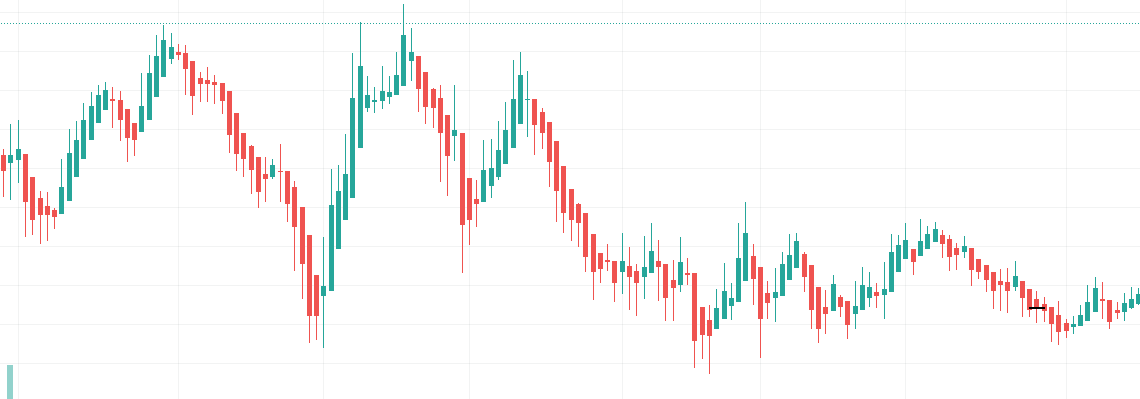
Time Frame importance -
— My First Stock (@myfirststock99) May 14, 2022
1) 3 min - For Execution
( indicators provide early signals and less reliable)
2) 15 min - to look at trend of week, Support and Resistance of last 4-5 days
3) Daily - to check current trend and Short Term S-R (More reliability)
Charts - pic.twitter.com/SWHcQQ8m0F