That’s collateral.
You want to buy a house.
You take a loan from the bank.
The bank asks you, “what if you don’t pay back?”
You say, “take my home and sell it”.
(Thread)
That’s collateral.
So a loan where the bank has collateral is considered safer for the bank.
The economy had just recovered from the tech bubble in 2000 where many banks had given out loans to businesses that had shut down.
They did so.
Banks made good money by selling these loans. There was a demand for it.
So they started giving out even more loans to supply the high demand.
Banks give out money to borrowers to buy a house.
Then, banks sell this mortgage to institutional investors.
So they again have money.
This money they lend out again.
Again, they sell this new mortgage to institutional investors.
And so does the price of houses.
But towards the end of 2007, many people start defaulting on their loans.
No big deal.
They start putting these houses up for sale.
More people default on their loans.
More houses come on sale.
Supply and demand kick in.
There are so many houses on sale and not enough buyers.
So house prices start falling.
More borrowers start defaulting on their loans. More houses come on sale. Houses continue to become so cheap, borrowers cannot recover their money.
Banks run out of money to lend.
With some industries slowing down, the economic cycle starts getting affected.
With that, comes job losses.
With job losses, comes reduced spending.
With reduced spending, comes a slowdown.
Right after the 2000 tech bubble, investors and the entire economic system was determined to avoid another tech bubble.
The US being such a major economy, this recession affected the entire globe.
The impact of such massive events is that people’s focus is on making sure the same doesn’t repeat.
That continued right from 2012 to 2020.
In 2020, the markets fell just as sharply.
It was caused by a pandemic - a threat nobody quite expected or saw coming.
The lesson for the investor is the same be it the tech bubble of 2000, the Great Recession of 2008, or the pandemic of 2020.
More from All

MASTER THREAD on Short Strangles.
Curated the best tweets from the best traders who are exceptional at managing strangles.
• Positional Strangles
• Intraday Strangles
• Position Sizing
• How to do Adjustments
• Plenty of Examples
• When to avoid
• Exit Criteria
How to sell Strangles in weekly expiry as explained by boss himself. @Mitesh_Engr
• When to sell
• How to do Adjustments
• Exit
Beautiful explanation on positional option selling by @Mitesh_Engr
Sir on how to sell low premium strangles yourself without paying anyone. This is a free mini course in
1st Live example of managing a strangle by Mitesh Sir. @Mitesh_Engr
• Sold Strangles 20% cap used
• Added 20% cap more when in profit
• Booked profitable leg and rolled up
• Kept rolling up profitable leg
• Booked loss in calls
• Sold only
2nd example by @Mitesh_Engr Sir on converting a directional trade into strangles. Option Sellers can use this for consistent profit.
• Identified a reversal and sold puts
• Puts decayed a lot
• When achieved 2% profit through puts then sold
Curated the best tweets from the best traders who are exceptional at managing strangles.
• Positional Strangles
• Intraday Strangles
• Position Sizing
• How to do Adjustments
• Plenty of Examples
• When to avoid
• Exit Criteria
How to sell Strangles in weekly expiry as explained by boss himself. @Mitesh_Engr
• When to sell
• How to do Adjustments
• Exit
1. Let's start option selling learning.
— Mitesh Patel (@Mitesh_Engr) February 10, 2019
Strangle selling. ( I am doing mostly in weekly Bank Nifty)
When to sell? When VIX is below 15
Assume spot is at 27500
Sell 27100 PE & 27900 CE
say premium for both 50-50
If bank nifty will move in narrow range u will get profit from both.
Beautiful explanation on positional option selling by @Mitesh_Engr
Sir on how to sell low premium strangles yourself without paying anyone. This is a free mini course in
Few are selling 20-25 Rs positional option selling course.
— Mitesh Patel (@Mitesh_Engr) November 3, 2019
Nothing big deal in that.
For selling weekly option just identify last week low and high.
Now from that low and high keep 1-1.5% distance from strike.
And sell option on both side.
1/n
1st Live example of managing a strangle by Mitesh Sir. @Mitesh_Engr
• Sold Strangles 20% cap used
• Added 20% cap more when in profit
• Booked profitable leg and rolled up
• Kept rolling up profitable leg
• Booked loss in calls
• Sold only
Sold 29200 put and 30500 call
— Mitesh Patel (@Mitesh_Engr) April 12, 2019
Used 20% capital@44 each
2nd example by @Mitesh_Engr Sir on converting a directional trade into strangles. Option Sellers can use this for consistent profit.
• Identified a reversal and sold puts
• Puts decayed a lot
• When achieved 2% profit through puts then sold
Already giving more than 2% return in a week. Now I will prefer to sell 32500 call at 74 to make it strangle in equal ratio.
— Mitesh Patel (@Mitesh_Engr) February 7, 2020
To all. This is free learning for you. How to play option to make consistent return.
Stay tuned and learn it here free of cost. https://t.co/7J7LC86oW0


You May Also Like


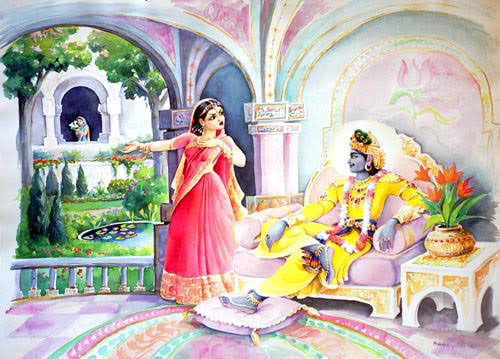
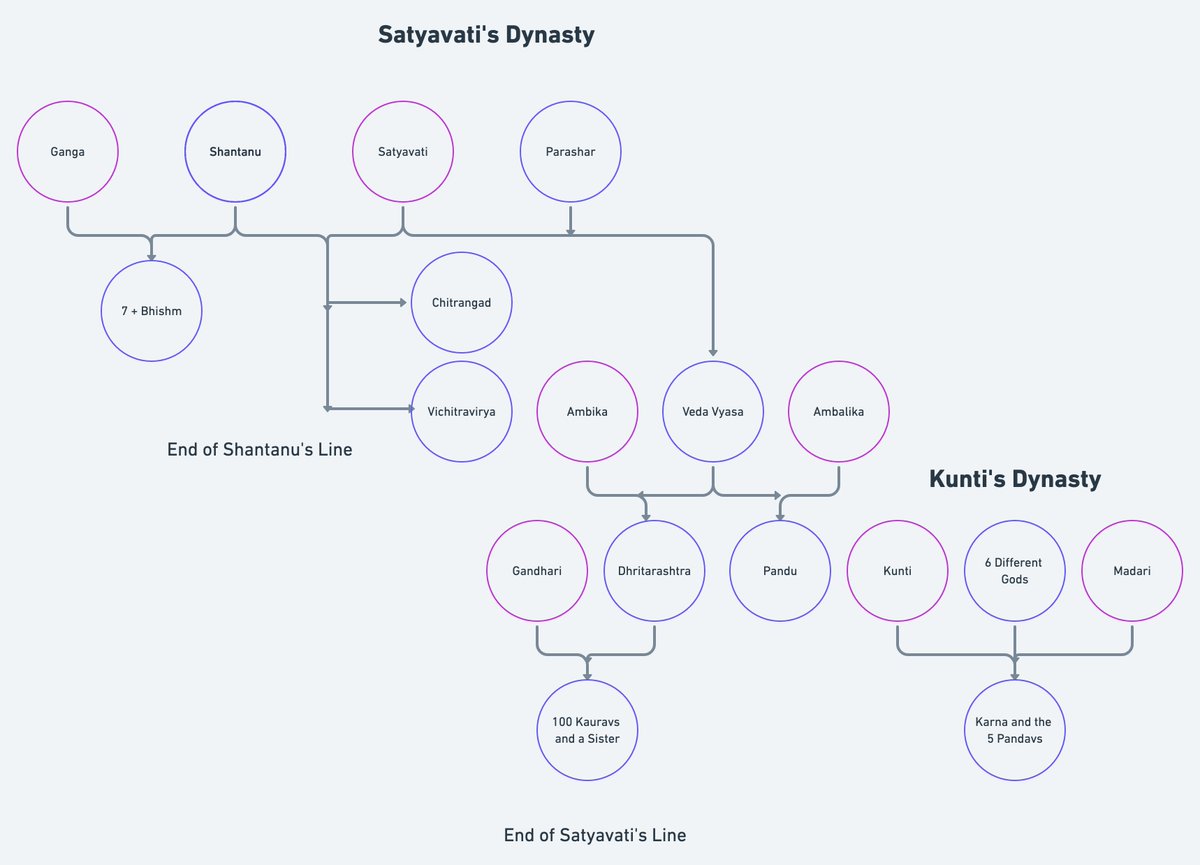
IMPORTANCE, ADVANTAGES AND CHARACTERISTICS OF BHAGWAT PURAN
It was Ved Vyas who edited the eighteen thousand shlokas of Bhagwat. This book destroys all your sins. It has twelve parts which are like kalpvraksh.
In the first skandh, the importance of Vedvyas
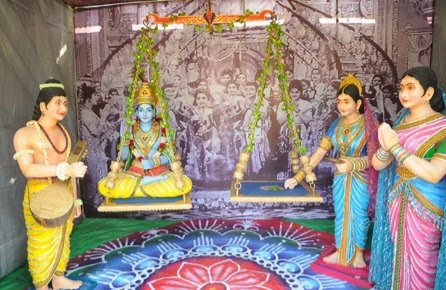
and characters of Pandavas are described by the dialogues between Suutji and Shaunakji. Then there is the story of Parikshit.
Next there is a Brahm Narad dialogue describing the avtaar of Bhagwan. Then the characteristics of Puraan are mentioned.
It also discusses the evolution of universe.( https://t.co/2aK1AZSC79 )
Next is the portrayal of Vidur and his dialogue with Maitreyji. Then there is a mention of Creation of universe by Brahma and the preachings of Sankhya by Kapil Muni.
In the next section we find the portrayal of Sati, Dhruv, Pruthu, and the story of ancient King, Bahirshi.
In the next section we find the character of King Priyavrat and his sons, different types of loks in this universe, and description of Narak. ( https://t.co/gmDTkLktKS )
In the sixth part we find the portrayal of Ajaamil ( https://t.co/LdVSSNspa2 ), Daksh and the birth of Marudgans( https://t.co/tecNidVckj )
In the seventh section we find the story of Prahlad and the description of Varnashram dharma. This section is based on karma vaasna.
It was Ved Vyas who edited the eighteen thousand shlokas of Bhagwat. This book destroys all your sins. It has twelve parts which are like kalpvraksh.
In the first skandh, the importance of Vedvyas
and characters of Pandavas are described by the dialogues between Suutji and Shaunakji. Then there is the story of Parikshit.
Next there is a Brahm Narad dialogue describing the avtaar of Bhagwan. Then the characteristics of Puraan are mentioned.
It also discusses the evolution of universe.( https://t.co/2aK1AZSC79 )
Next is the portrayal of Vidur and his dialogue with Maitreyji. Then there is a mention of Creation of universe by Brahma and the preachings of Sankhya by Kapil Muni.
HOW LIFE EVOLVED IN THIS UNIVERSE AS PER OUR SCRIPTURES.
— Anshul Pandey (@Anshulspiritual) August 29, 2020
Well maximum of Living being are the Vansaj of Rishi Kashyap. I have tried to give stories from different-different Puran. So lets start.... pic.twitter.com/MrrTS4xORk
In the next section we find the portrayal of Sati, Dhruv, Pruthu, and the story of ancient King, Bahirshi.
In the next section we find the character of King Priyavrat and his sons, different types of loks in this universe, and description of Narak. ( https://t.co/gmDTkLktKS )
Thread on NARK(HELL) / \u0928\u0930\u094d\u0915
— Anshul Pandey (@Anshulspiritual) August 11, 2020
Well today i will take you to a journey where nobody wants to go i.e Nark. Hence beware of doing Adharma/Evil things. There are various mentions in Puranas about Nark, But my Thread is only as per Bhagwat puran(SS attached in below Thread)
1/8 pic.twitter.com/raHYWtB53Q
In the sixth part we find the portrayal of Ajaamil ( https://t.co/LdVSSNspa2 ), Daksh and the birth of Marudgans( https://t.co/tecNidVckj )
In the seventh section we find the story of Prahlad and the description of Varnashram dharma. This section is based on karma vaasna.
#THREAD
— Anshul Pandey (@Anshulspiritual) August 12, 2020
WHY PARENTS CHOOSE RELIGIOUS OR PARAMATMA'S NAMES FOR THEIR CHILDREN AND WHICH ARE THE EASIEST WAY TO WASH AWAY YOUR SINS.
Yesterday I had described the types of Naraka's and the Sin or Adharma for a person to be there.
1/8 pic.twitter.com/XjPB2hfnUC