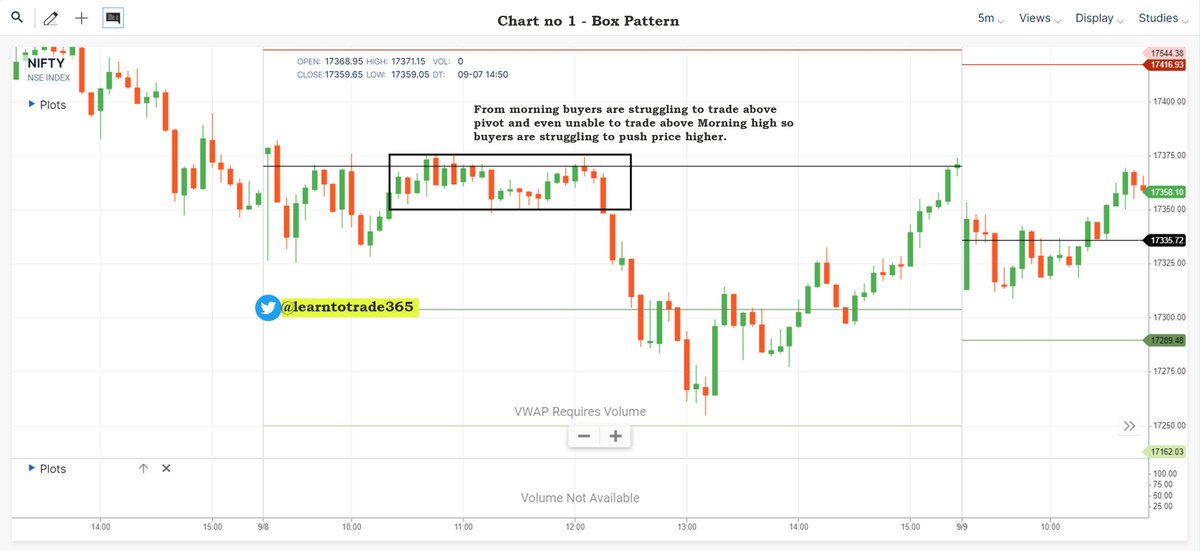
Price Action pattern for intraday trading
A small thread
Traders show your support by like & retweet to benefit maximum traders
@Puretechnicals9 @AnandableAnand @Abhishekkar_ @ProdigalTrader @nakulvibhor @RajarshitaS @Rishikesh_ADX @Stockstudy8 @vivbajaj



More from Learn to Trade
Twitter is filled with knowledge so let's today focus on few trading related knowledge shared by various traders
A mega thread 🧵on various content related to trading
1/11 🧵
Retweet and share to benefit maximum traders
Checklist for Option buying thread by ( @asitbaran )
2/11
Trading via spread by @Ronak_Unadkat complied by @AdityaTodmal
3/11
Option strike price selection by @ITRADE191 complied by @AdityaTodmal
4/11
Data points to check as a option sellers by @kapildhama
5/11
A mega thread 🧵on various content related to trading
1/11 🧵
Retweet and share to benefit maximum traders
Checklist for Option buying thread by ( @asitbaran )
2/11
A thread on Basic Checklist while going Long Options.
— Asit Baran Pati \U0001f1ee\U0001f1f3 (@asitbaran) May 24, 2021
Thought of writing this post for people who are doing Option Buying and losing money. It can be very basic, so Pros please may give a skip.
Just a checklist so that you don\u2019t lose big money by Long Option strategies
Trading via spread by @Ronak_Unadkat complied by @AdityaTodmal
3/11
The best spreads trader on Twitter: @Ronak_Unadkat
— Aditya Todmal (@AdityaTodmal) March 6, 2022
He trades in Nifty & Bank Nifty via spreads majorly.
In the Jainam Broking Speech, he shared how he trades debit and credit spreads:
Here's a breakdown of his 10 step method: \U0001f9f5
Collaborated with @niki_poojary
Option strike price selection by @ITRADE191 complied by @AdityaTodmal
4/11
A THREAD on . . . .
— Aditya Todmal (@AdityaTodmal) March 29, 2021
How @ITRADE191 selects strikes to trade in and how he follows risk management.
Short thread explained via pictures with the help of @niki_poojary.
Data points to check as a option sellers by @kapildhama
5/11
2 hours of non-stop Twitter space by @kapildhama
— Learn to Trade (@learntotrade365) January 17, 2022
Topic - Data Points to check as a Option seller
Mega Thread \U0001f9f5 of all the data points to check as a option seller shared by Mr. Kapil Dhama is complied
Retweet to reach wider -Learning should never stop#StockMarketindia
1/18 https://t.co/m0NXToSU1p pic.twitter.com/GkjArctHsR




Learning Web series for Traders
Price Action Trading - Part 1
Small thread /Video
Video link - https://t.co/7V2pz0aCdx
Traders support by like & retweet to benefit all
@Mitesh_Engr @ITRADE191 @ProdigalTrader @nakulvibhor @RajarshitaS @Stockstudy8 @vivbajaj @Prakashplutus https://t.co/ZKBMSEZkTl

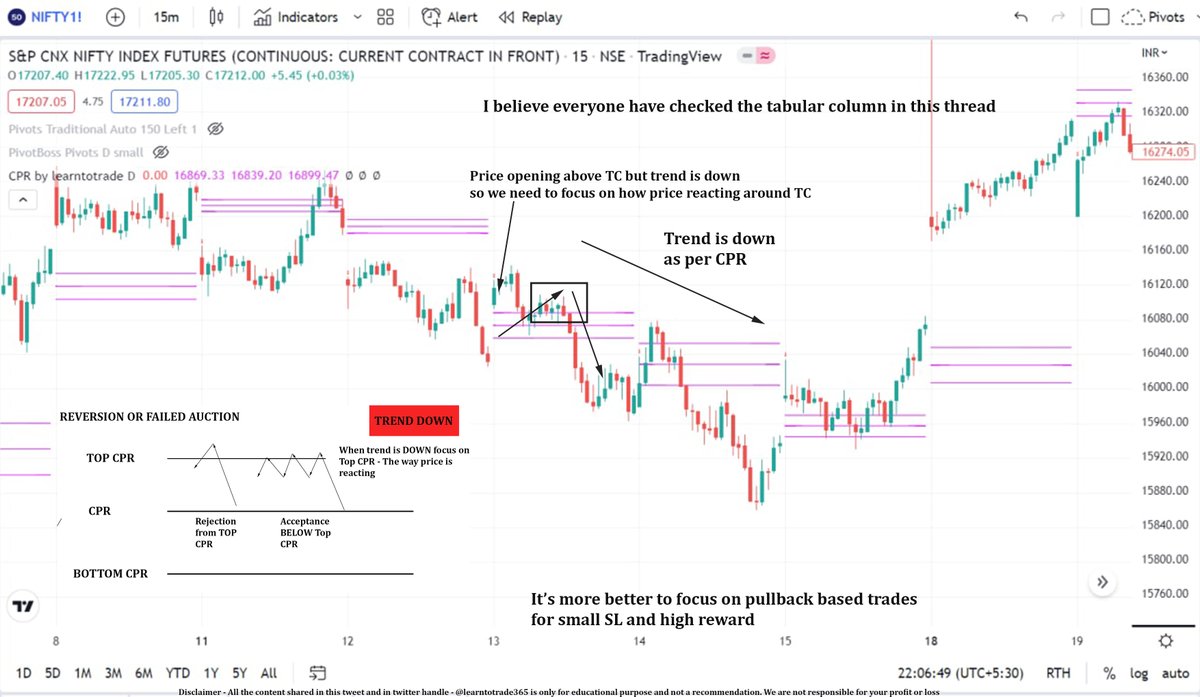
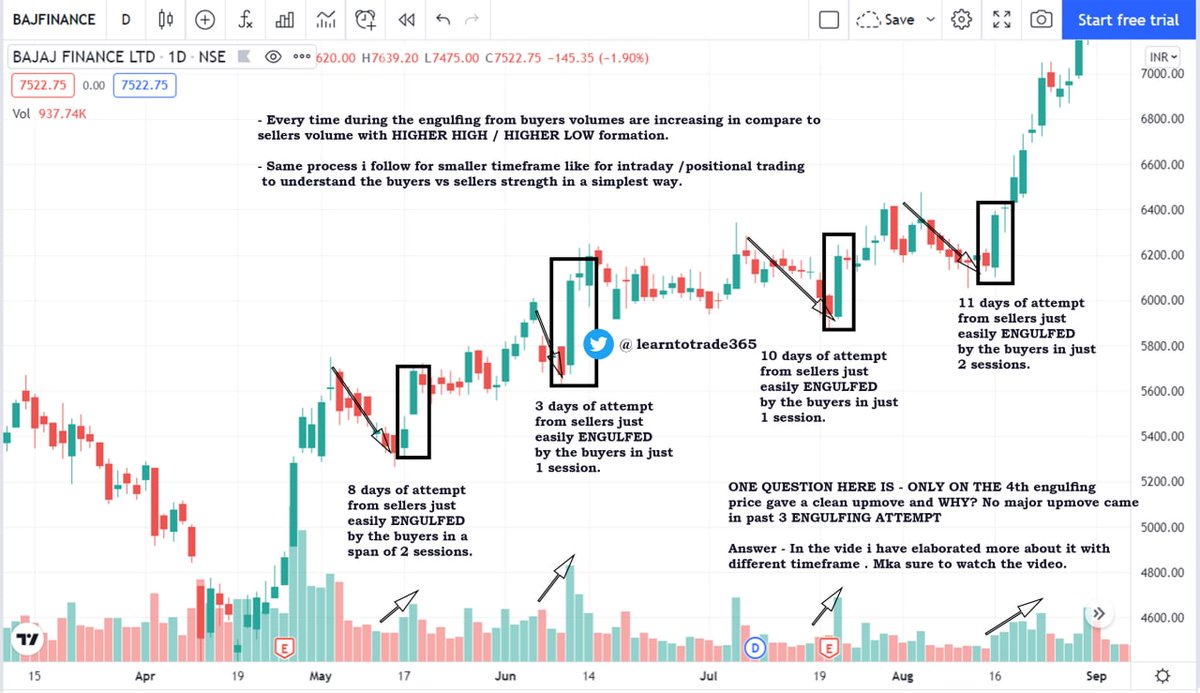
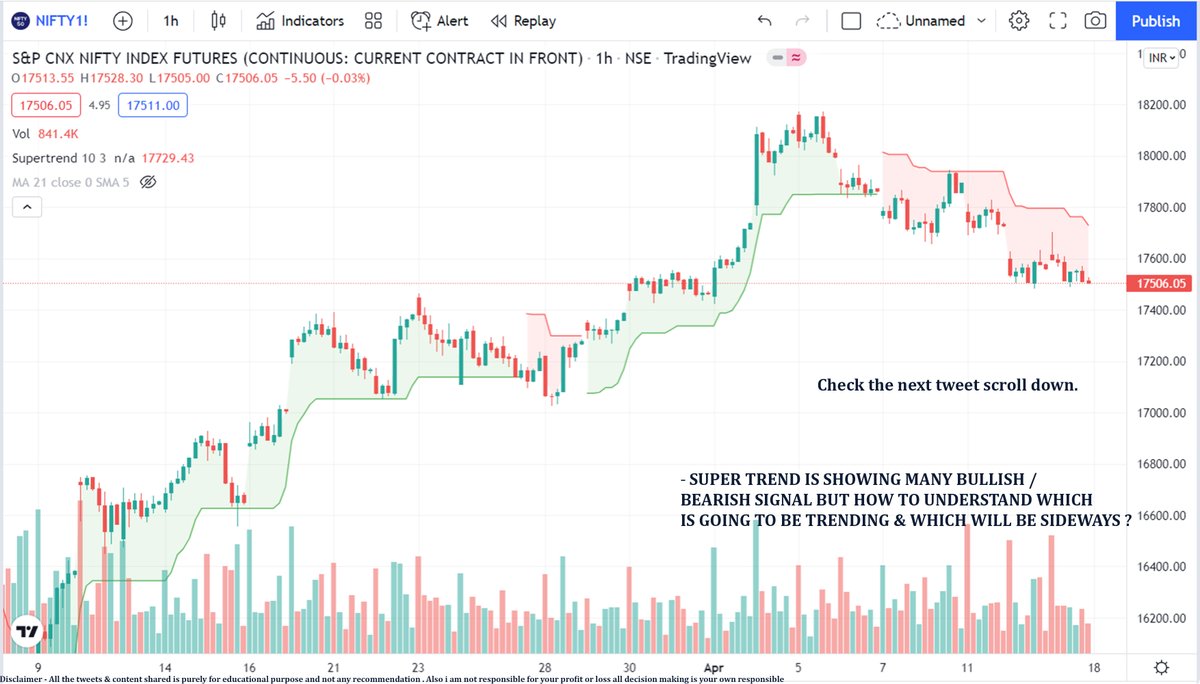
1/4 Engulfing Candle along with the trend. In this case bullish trend. Scroll down and check the example. Also in a video format ( Video link - https://t.co/7V2pz0aCdx )
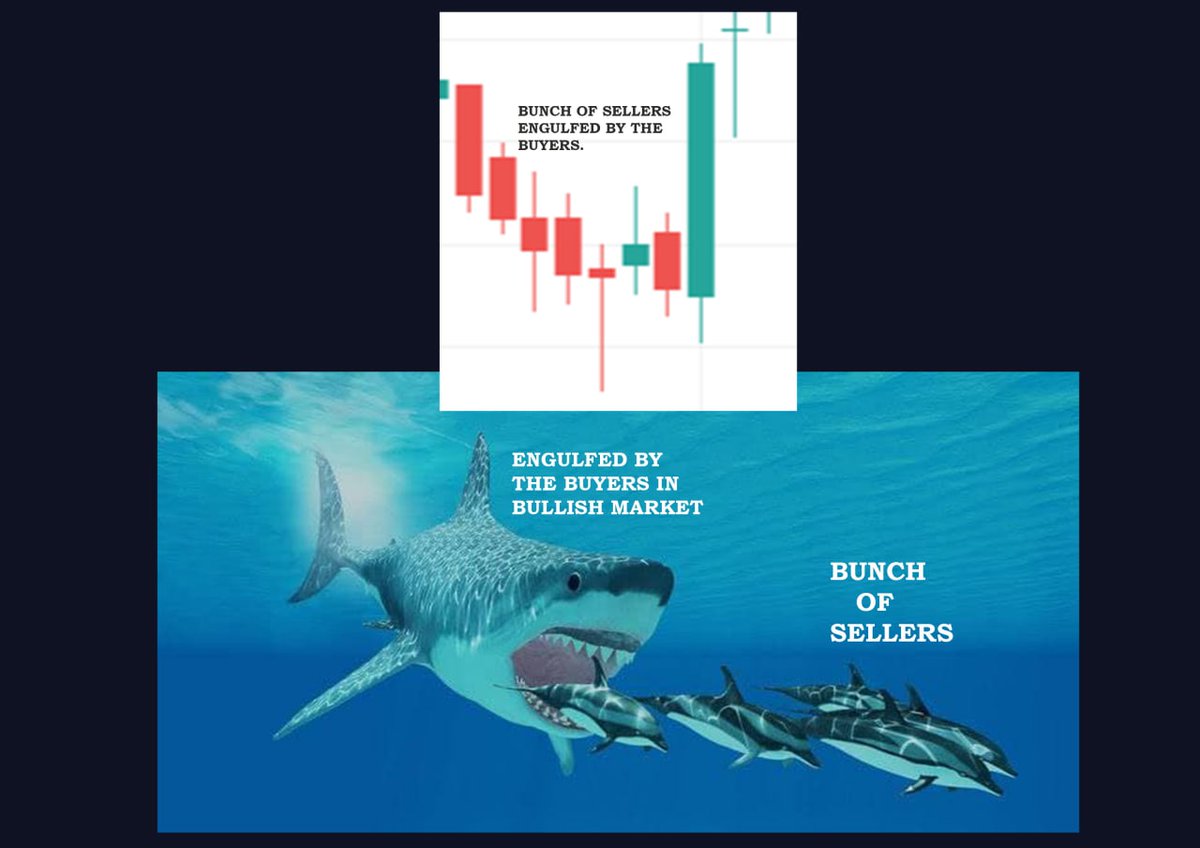
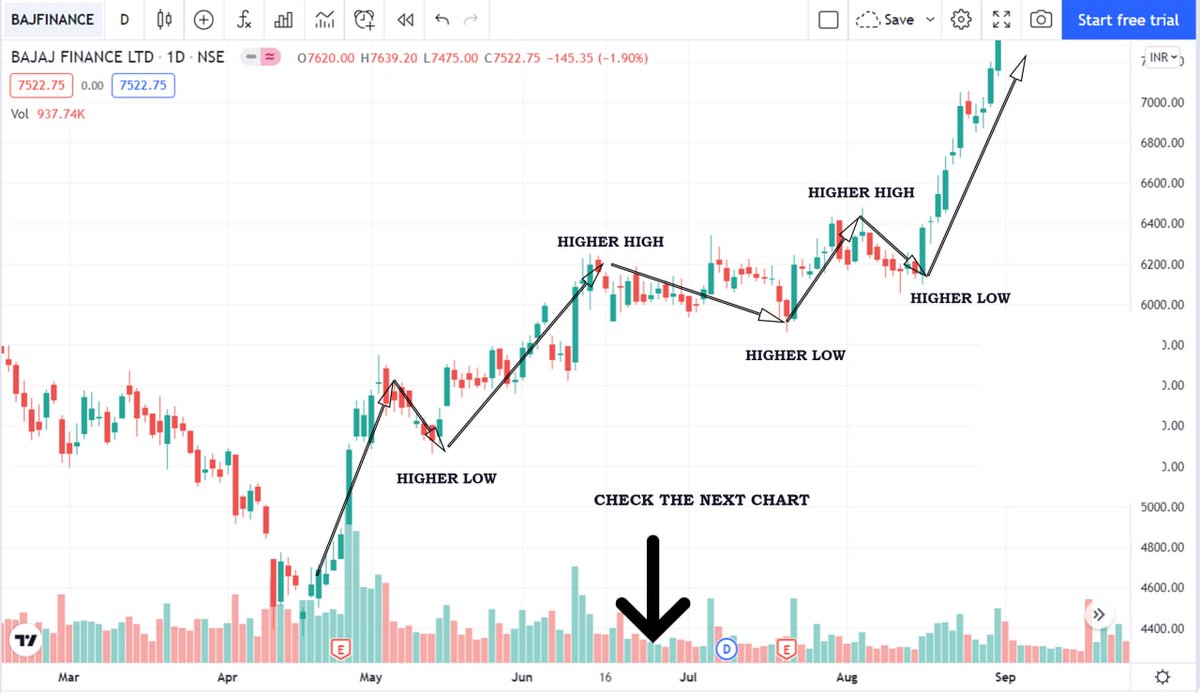
Higher High & Higher low is common in bull market but to understand the traders strength need to read the auction in the consolidated sideways range. So I have explained a simple engulfing concept. Scroll down

3/4
Video link - https://t.co/7V2pz0aCdx
Price Action Trading - Part 1
Small thread /Video
Video link - https://t.co/7V2pz0aCdx
Traders support by like & retweet to benefit all
@Mitesh_Engr @ITRADE191 @ProdigalTrader @nakulvibhor @RajarshitaS @Stockstudy8 @vivbajaj @Prakashplutus https://t.co/ZKBMSEZkTl
1/4 Engulfing Candle along with the trend. In this case bullish trend. Scroll down and check the example. Also in a video format ( Video link - https://t.co/7V2pz0aCdx )
Higher High & Higher low is common in bull market but to understand the traders strength need to read the auction in the consolidated sideways range. So I have explained a simple engulfing concept. Scroll down
3/4
Video link - https://t.co/7V2pz0aCdx



2 hours of non-stop Twitter space by @kapildhama
Topic - Data Points to check as a Option seller
Mega Thread 🧵 of all the data points to check as a option seller shared by Mr. Kapil Dhama is complied
Retweet to reach wider -Learning should never stop
#StockMarketindia
1/18 https://t.co/m0NXToSU1p
2/18
-Make your own trading system
- First identify what suits you ?
Trend Following
Directional or Non-directional option selling
9:20straddle
Naked option buying/selling
-Never take more than 1% loss in intraday
-There is no specific trick in market only important is process
3/18
-Chart & Data plays a important role ( Understand to combine to identify trades/direction )
-In all trades knowing exit point is very important
Simple target for Kapil sir in straddle is 100 points in a week on BNF & Loss exit point is 50 points after adjustment (R:R 1:2)
4/18
- Simple target for Kapil sir in straddle is 50 points in a week on NF & Loss exit point is 25 points after adjustment (R:R 1:2)
Check data after 3:00 p.m Chart + Data ?
Check how is the closing ( Location of closing - Near Day high or Day low or mid of the day )
5/18
Example:
-If market is near high ( Check in data whether Near ATM PE has more writing & in CE writing whether is less at higher strike price) - It is a Probability
Once Data is bullish along with the close he choose
Strangle- Rs.70 PE & Rs.40 CE or scroll down
Topic - Data Points to check as a Option seller
Mega Thread 🧵 of all the data points to check as a option seller shared by Mr. Kapil Dhama is complied
Retweet to reach wider -Learning should never stop
#StockMarketindia
1/18 https://t.co/m0NXToSU1p
\U0001f50a Twitter Space with @kapildhama for the first time
— Learn to Trade (@learntotrade365) January 15, 2022
Topic - Data points to check as a option seller
Sunday ( 16/01/22 ) evening 06:00 p.m
Link - https://t.co/XMaoRfOWp4
Click on the link and set reminder #stockmarkets #trading #StockMarketindia pic.twitter.com/HRPEooa5H2
2/18
-Make your own trading system
- First identify what suits you ?
Trend Following
Directional or Non-directional option selling
9:20straddle
Naked option buying/selling
-Never take more than 1% loss in intraday
-There is no specific trick in market only important is process
3/18
-Chart & Data plays a important role ( Understand to combine to identify trades/direction )
-In all trades knowing exit point is very important
Simple target for Kapil sir in straddle is 100 points in a week on BNF & Loss exit point is 50 points after adjustment (R:R 1:2)
4/18
- Simple target for Kapil sir in straddle is 50 points in a week on NF & Loss exit point is 25 points after adjustment (R:R 1:2)
Check data after 3:00 p.m Chart + Data ?
Check how is the closing ( Location of closing - Near Day high or Day low or mid of the day )
5/18
Example:
-If market is near high ( Check in data whether Near ATM PE has more writing & in CE writing whether is less at higher strike price) - It is a Probability
Once Data is bullish along with the close he choose
Strangle- Rs.70 PE & Rs.40 CE or scroll down
More from Ta


Thread Master File -
All my threads will be listed under here

Need help getting better entries ?
Here is your thread
This is How you can be green on every trade via risk management
Thread on high profitability support and resistance setups & trigger points.
Here’s the Jimmy Momo Script, hope you all love it
All my threads will be listed under here
Need help getting better entries ?
Here is your thread
Thread on Finding Entries.
— James Lefaith aka Jimmy Momo (@JamesLefaith) June 15, 2021
Firstly you have to be able to identify and area of value for an add.
NEVER BLINDLY BUY\u203c\ufe0f
ALWAYS BUY AT A KEY LEVEL OF SUPPORT, CONFIRMATION & OR IN SOME INSTANCES EVEN AT A BREAK OF A RESISTANCE LEVEL
\u203c\ufe0fThis is how you do that
This is How you can be green on every trade via risk management
RISK MANAGEMENT THREAD
— James Lefaith aka Jimmy Momo (@JamesLefaith) June 17, 2021
Bookmark this; it\u2019s important.
This thread will help you exit (Mostly) EVERY TRADE GREEN but MOST IMPORTANTLY will help you mitigate risk.
HERE is some proof. pic.twitter.com/RNFJtOqJ9C
Thread on high profitability support and resistance setups & trigger points.
\U0001f90dThread on My Support & Resistance System\U0001f90d
— James Lefaith aka Jimmy Momo (@JamesLefaith) June 19, 2021
This Thread Will Help you guys identify favorable, highly profitable, quick and smart money decision areas to add for your entries.
This Thread was requested by my good friends @DevTrades21 and @jessasecond1. Give Them a Follow
Here’s the Jimmy Momo Script, hope you all love it
EVERYONE Here\u2019s the moment we\u2019ve been waiting for, Here is the TOS study based on my candle system.
— James Lefaith aka Jimmy Momo (@JamesLefaith) September 12, 2021
Script created by @richard_the_red everyone give him a follow & thank him for putting in the time. We really hope you all enjoy it & put it to good use https://t.co/0hzRfQ3uGg


Moving Averages 📚
💎SECRET INFO inside
🧠Great for both beginners & advanced traders
▪️ What are they?
▪️ Types of MAs
▪️ Why are they such a powerful tool?
▪️ How to properly use them?
▪️ My best SECRET EMA value?
▪️ Which Timeframe to use?
▪️ Advanced EMA technique?
1/20
▪️ What are they?
Moving average is nothing more than an average price of the last (value) of candles.
If we are gonna use an example of MA(50) it is gonna be the mean price of the last 50 candles
General rule:
Price above = Bullish 🐂
Price below = Bearish 🐻
2/20
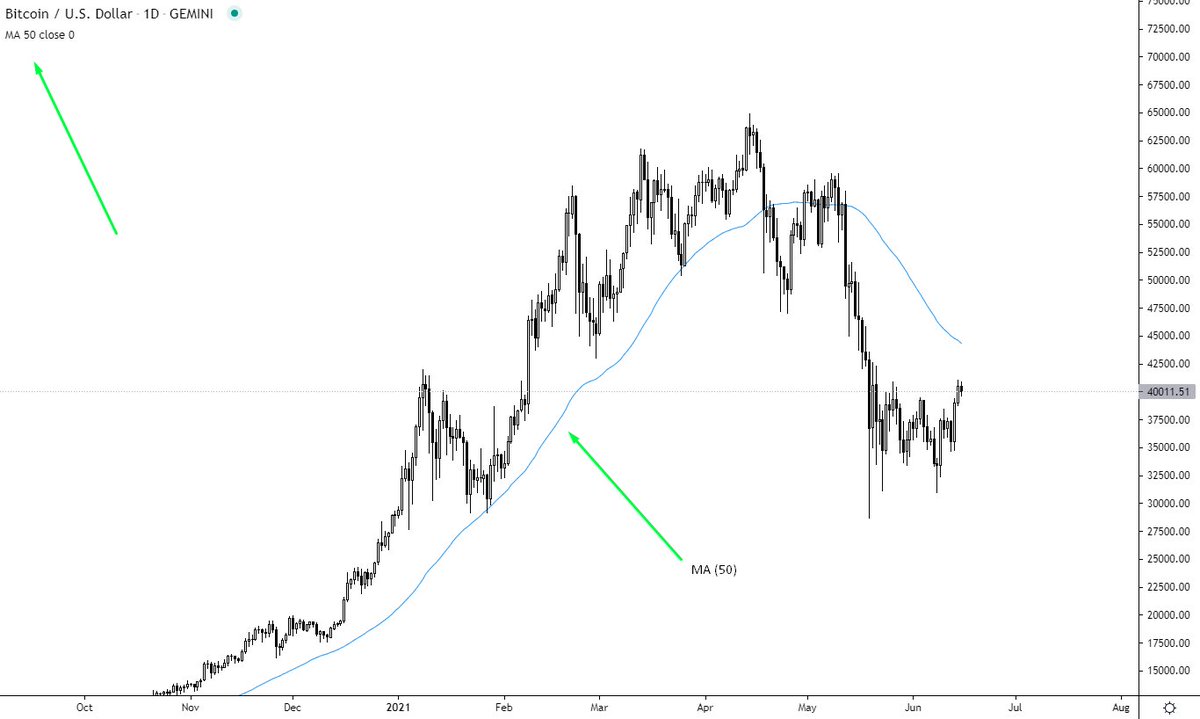
▪️ Types of Moving Averages
1) Simple Moving Average - SMA
2) Exponential Moving Average - EMA
3) Smoothed Moving Average - SMMA
4) Volume Weighted Average Price - VWAP
There are a few more but these are the most important in my opinion.
3/20
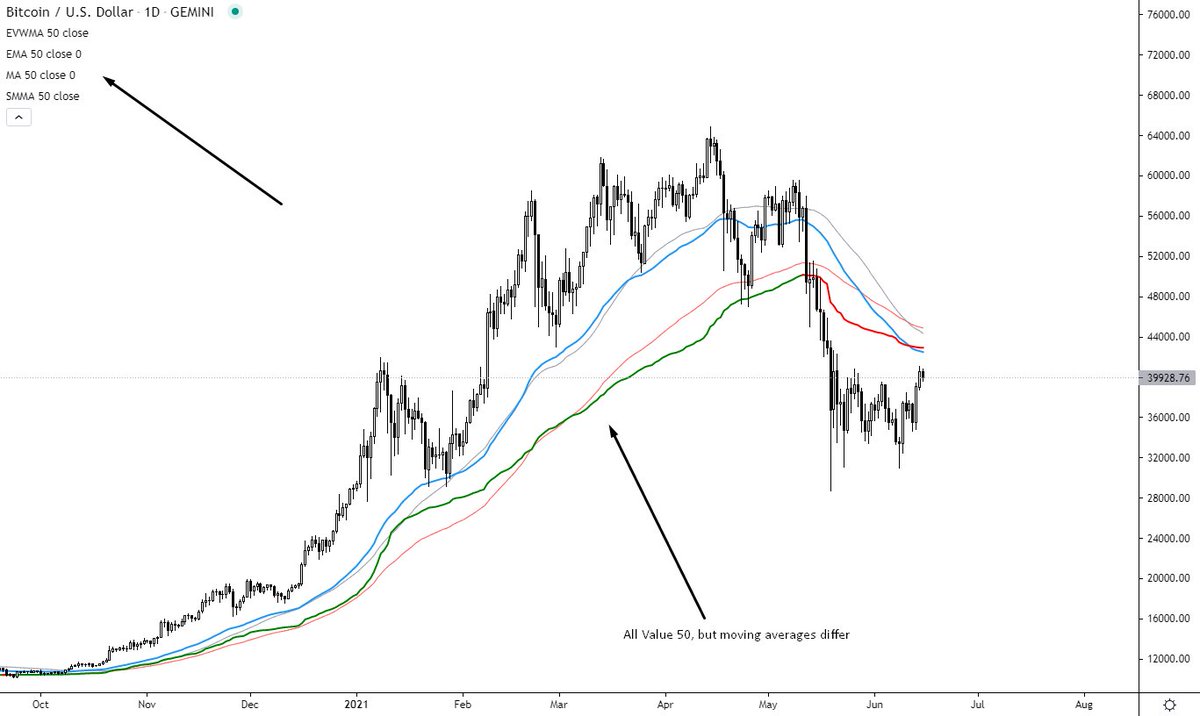
I won't be going that much into detail about each of them in this thread but more so covering MAs in general.
The important takeaway is there are many methods of calculations and each offers bit different pros & cons
I'll leave experimenting with each of them up to you
4/20
▪️ Why are they such a powerful tool?
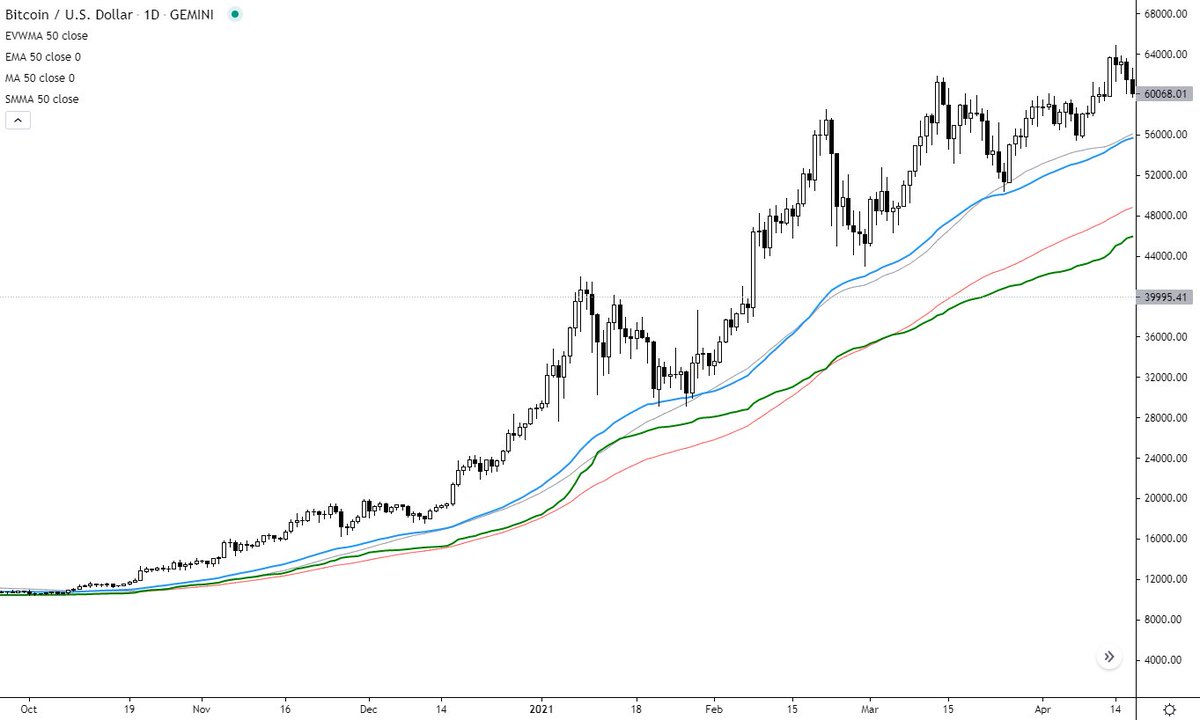
Because they help everyone, even newbies, that are just starting out, to easily & visually clearly identify trends without understanding the advanced Market Structure techniques.
Price above = 🐂
5/20
https://t.co/g5SneLNPh5
💎SECRET INFO inside
🧠Great for both beginners & advanced traders
▪️ What are they?
▪️ Types of MAs
▪️ Why are they such a powerful tool?
▪️ How to properly use them?
▪️ My best SECRET EMA value?
▪️ Which Timeframe to use?
▪️ Advanced EMA technique?
1/20
▪️ What are they?
Moving average is nothing more than an average price of the last (value) of candles.
If we are gonna use an example of MA(50) it is gonna be the mean price of the last 50 candles
General rule:
Price above = Bullish 🐂
Price below = Bearish 🐻
2/20
▪️ Types of Moving Averages
1) Simple Moving Average - SMA
2) Exponential Moving Average - EMA
3) Smoothed Moving Average - SMMA
4) Volume Weighted Average Price - VWAP
There are a few more but these are the most important in my opinion.
3/20
I won't be going that much into detail about each of them in this thread but more so covering MAs in general.
The important takeaway is there are many methods of calculations and each offers bit different pros & cons
I'll leave experimenting with each of them up to you
4/20
▪️ Why are they such a powerful tool?
Because they help everyone, even newbies, that are just starting out, to easily & visually clearly identify trends without understanding the advanced Market Structure techniques.
Price above = 🐂
5/20
https://t.co/g5SneLNPh5
Market Structure (MS)
— J A C K I S (@jackis_trader) July 6, 2020
Understanding MS is the most important thing in TA
It rules above everything. TL's, MA's, Indicators. Everything.
While it's nothing more than looking at swings and seeing Higher Highs (HH), Highers Lows (HL), Lower Highs (LH), and Lower Lows (LL). pic.twitter.com/QbgOSHGkBr

25k webinar Done in a tweet
A sweet and simple BNF Setup i use
Alligator Setup
Retweet so that everyone can get benefited.
Check Full thread for full strategy.
1. You have to use 2 charts simultaneously , first chart of bank nifty spot 15 min time frame , candle used heikin ashi
Second chart 15 min bnf future normal candle.
2. Indicator used is alligator , in the indicator you have to only use the jaw of indicator.
3. Whenever spot and future candle closes simultaneously below the jaw line , short at the low of the candle which closed below the jawline.
4. Whenever spot and future candle closes simultaneously above the jaw line , buy at the high of the candle which closes above the jawline.
5. Target and Stoploss - Ideal target which i personally take is 100 points.
Stoploss also 100 points.
On trending days you can trail and take 200/300/400 points also.
I have personally made maximum 624 points in bank nifty in a single trade.
6. Precautions - never trade on sideways days.
7. Never trade on gap up or gapdown of more than 100 points .
I have made a detailed video on the same.
Link https://t.co/XMolGUKZPF
Thankyou for reading.
A sweet and simple BNF Setup i use
Alligator Setup
Retweet so that everyone can get benefited.
Check Full thread for full strategy.
1. You have to use 2 charts simultaneously , first chart of bank nifty spot 15 min time frame , candle used heikin ashi
Second chart 15 min bnf future normal candle.
2. Indicator used is alligator , in the indicator you have to only use the jaw of indicator.
3. Whenever spot and future candle closes simultaneously below the jaw line , short at the low of the candle which closed below the jawline.
4. Whenever spot and future candle closes simultaneously above the jaw line , buy at the high of the candle which closes above the jawline.
5. Target and Stoploss - Ideal target which i personally take is 100 points.
Stoploss also 100 points.
On trending days you can trail and take 200/300/400 points also.
I have personally made maximum 624 points in bank nifty in a single trade.
6. Precautions - never trade on sideways days.
7. Never trade on gap up or gapdown of more than 100 points .
I have made a detailed video on the same.
Link https://t.co/XMolGUKZPF
Thankyou for reading.