BC TA

Finding swing trading setups using Anchored VWAPs and Volume Shelf - A Thread ๐Ÿ‘‡

Anchored VWAP is the average price people paid from a specific anchor in the chart. Bulls and bears do not want stock to cross the average price they paid to buy/sell it!

$SPY $AFRM $V
(1/n)

Let's take an example of a bull run. When a breakout happens, or a reversal happens, or a rally begins, people start buying! We can assume such points as our anchor points!

Now as long as price stays above their average price, they are happy!

But what if it comes down!
(2/n)
If it comes down, those bulls might start buying again because anytime price will go below the anchored vwap from their initial buy point, they are in loss. THIS IS IMPORTANT!

They do not want to go in loss, so they start buying again pushing the price higher.
(3/n)
This is useful to know for everyone! Let's also couple this with something called a volume shelf.

Volume shelf shows you areas where most shares were traded. Similar to AVWAP, when price starts to cross below the shelf, bulls will step in because they are going in loss.
(4/n)
Now that we have a rough understanding of what pains bulls on an uptrend, and when do they step in to avoid any losses, we can move ahead.

For a bullish swing trade, our task is to now find setups that are on anchored VWAP supports + volume shelf supports.
(5/n)
Let's take a look at an example of $AFRM. You can see here that from the gap up AVWAP, we have a support below. We tried to go below it but buyers stepped in and price is above it now.

Same goes to the volume shelf level here! Buyers stepped in.
(6/n)
Let's take a look at another example - $SPY - This is just beautiful ๐Ÿ˜

You can see that an AVWAP from every dip's reversal point acts as a support for the next rallies! There's no other indicator that can do this consistently across the entire market! Trust me.
(7/n)
To wrap this up - you need two things for every bullish swing setup. You can reverse this for bearish setups.

1. AVWAP Support from some important level (better if we have multiple AVWAP supports)
2. Volume Shelf support.

The last part is - how do we find these? โ“
(8/n)
For that you can use our "Event AVWAP" on Stocks Dashboard to draw multiple anchored VWAPS and see if you have support levels. $V is an excellent example - so many supports ๐Ÿ‘‡

You can also use "Scany" to just filter for stocks on volume shelf & AVWAP supports.
(9/n)
I hope this is useful for everyone, even if you don't use our platform. Over my 3 years experience, I have not found any technical indicator that works better than anchored VWAP.

If you like this post, please retweet it and give us a follow at @Tradytics

Love you all ๐Ÿ™๐Ÿ˜
(end)

More from Ta

Thread Master File -

All my threads will be listed under here


Need help getting better entries ?
Here is your thread


This is How you can be green on every trade via risk management


Thread on high profitability support and resistance setups & trigger points.


Hereโ€™s the Jimmy Momo Script, hope you all love it
Moving Averages ๐Ÿ“š

๐Ÿ’ŽSECRET INFO inside

๐Ÿง Great for both beginners & advanced traders

โ–ช๏ธ What are they?
โ–ช๏ธ Types of MAs
โ–ช๏ธ Why are they such a powerful tool?
โ–ช๏ธ How to properly use them?
โ–ช๏ธ My best SECRET EMA value?
โ–ช๏ธ Which Timeframe to use?
โ–ช๏ธ Advanced EMA technique?

1/20


โ–ช๏ธ What are they?

Moving average is nothing more than an average price of the last (value) of candles.

If we are gonna use an example of MA(50) it is gonna be the mean price of the last 50 candles

General rule:
Price above = Bullish ๐Ÿ‚
Price below = Bearish ๐Ÿป

2/20


โ–ช๏ธ Types of Moving Averages

1) Simple Moving Average - SMA
2) Exponential Moving Average - EMA
3) Smoothed Moving Average - SMMA
4) Volume Weighted Average Price - VWAP

There are a few more but these are the most important in my opinion.

3/20


I won't be going that much into detail about each of them in this thread but more so covering MAs in general.

The important takeaway is there are many methods of calculations and each offers bit different pros & cons

I'll leave experimenting with each of them up to you

4/20

โ–ช๏ธ Why are they such a powerful tool?

Because they help everyone, even newbies, that are just starting out, to easily & visually clearly identify trends without understanding the advanced Market Structure techniques.

Price above = ๐Ÿ‚

5/20

https://t.co/g5SneLNPh5
Moving Averages is a common indicator which most of us (novice/professional) use in the stock market for trading and investment.

This learning thread would be on
"๐™๐™จ๐™š๐™จ ๐™ค๐™› ๐™ˆ๐™ค๐™ซ๐™ž๐™ฃ๐™œ ๐˜ผ๐™ซ๐™š๐™ง๐™–๐™œ๐™š"

Like๐Ÿ‘ & Retweet๐Ÿ”„ for wider reach and more such learning thread.

1/10

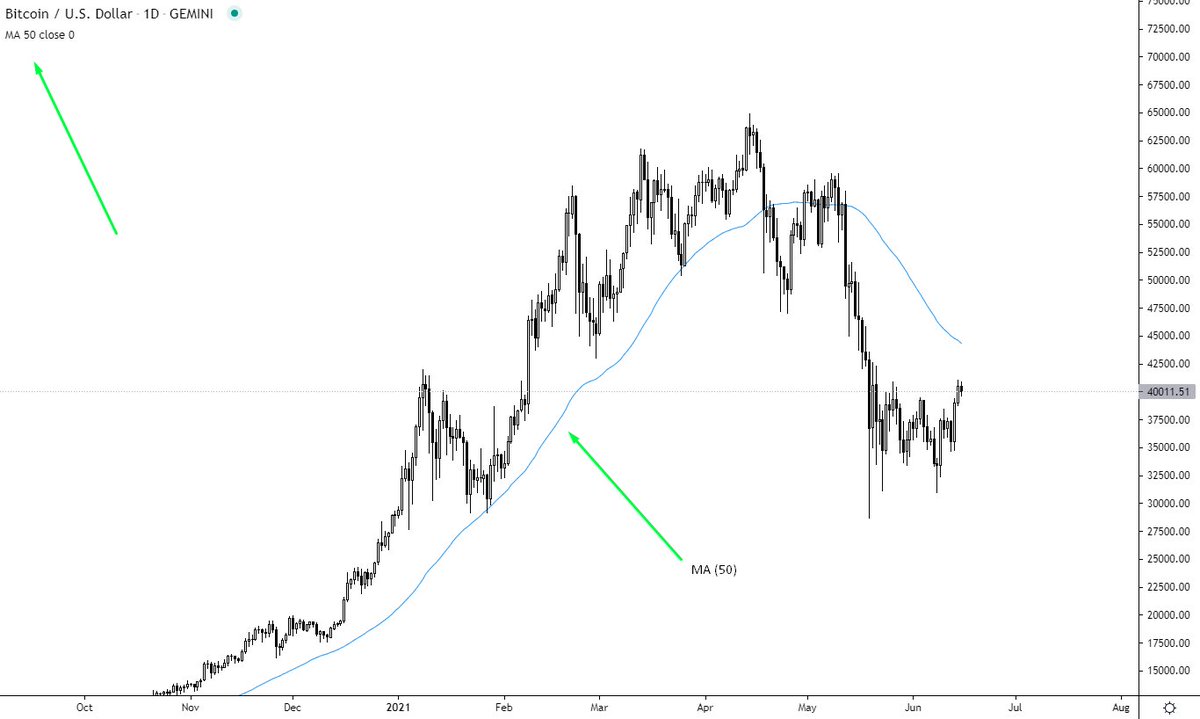
Basics of the moving average:

It takes average of the price for the duration we want.

So 10 days moving average means an average price of 10 days closing price.

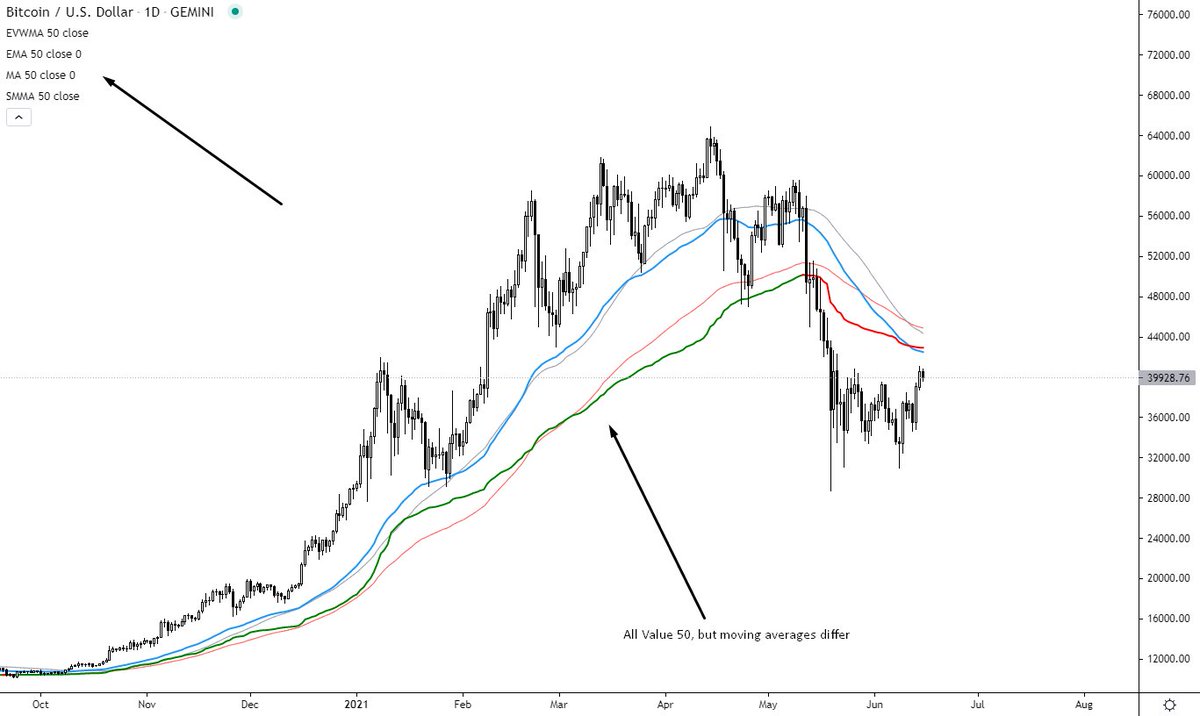
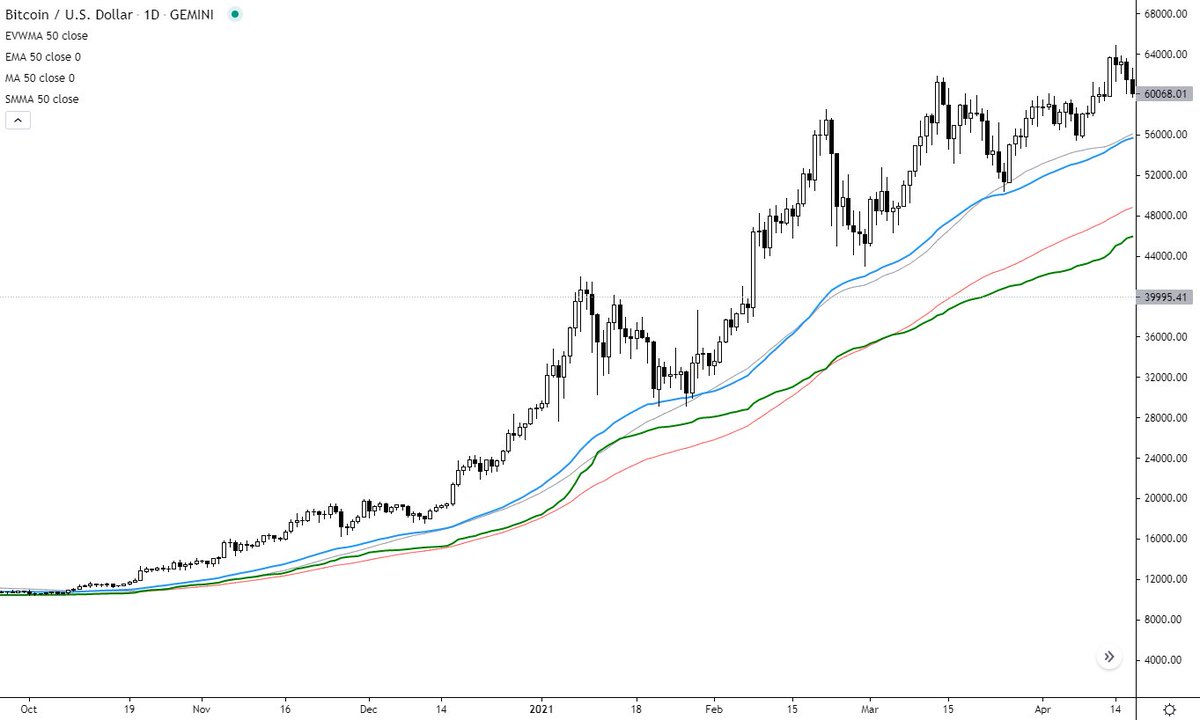
Common types of Moving Average:
Simple, Exponential, Weighted.

Use only one type in your trading setup.

2/10


Different uses:

1โƒฃ Moving Average Crossovers:

Common strategy used by positional traders and investor in finding multibagger or good returns stocks.

Common crossover used is for 50 & 200 Moving Average.

Also, this is called as "๐—š๐—ผ๐—น๐—ฑ๐—ฒ๐—ป ๐—–๐—ฟ๐—ผ๐˜€๐˜€๐—ผ๐˜ƒ๐—ฒ๐—ฟ"

3/10

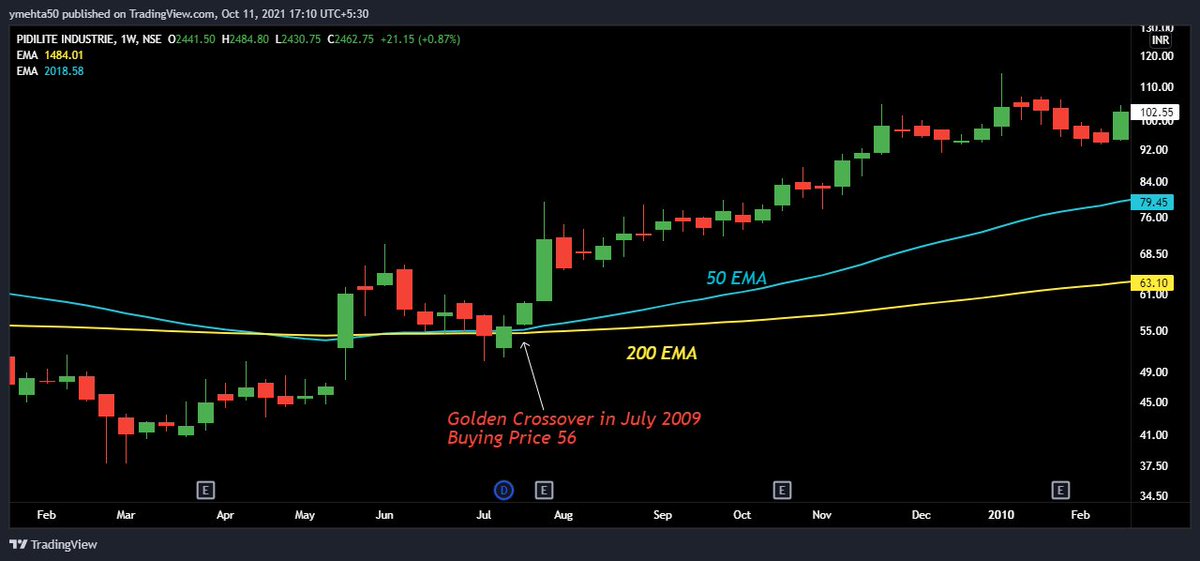
In this buy signal is initiated when lower MA (50 EMA) crosses above higher MA (200 EMA).
And exit or sell signal is intiated when lower MA (50 EMA) crosses below higher MA (200 EMA).

4/10

Let's see an example:
Pidilite Industries

Buying Price was 56 in 2009 and CMP is 2462 and still there is no selling signal.

44 times Multibagger or 4300% returns.

In lower time frame, it will give more whipsaw and more number of trades.

5/10

You May Also Like