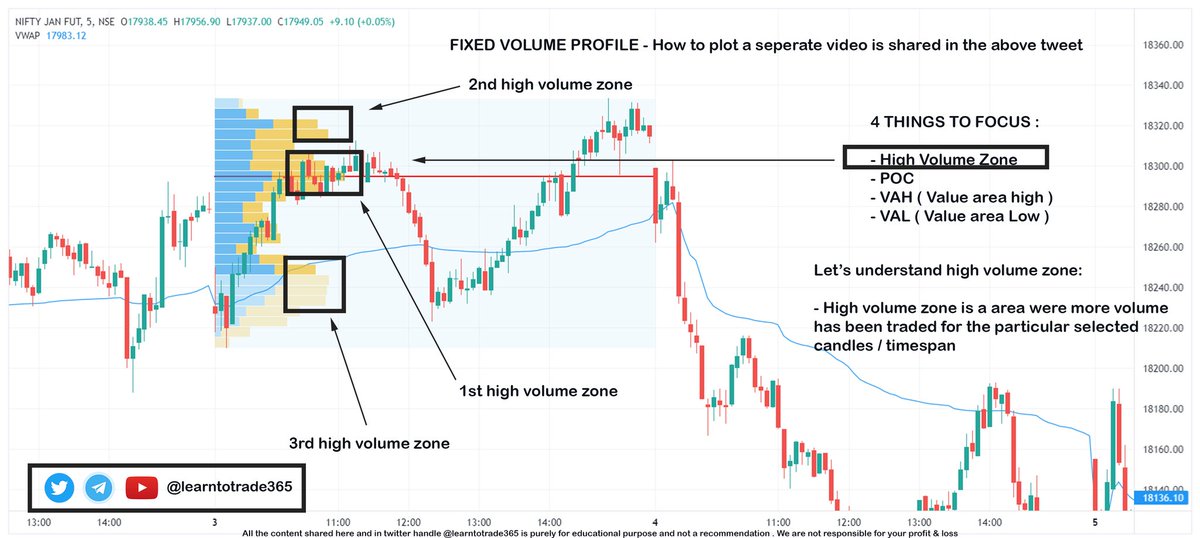
Watch the below video to understand the way to plot volume profile 👇
Scroll down to understand the terms and strategies


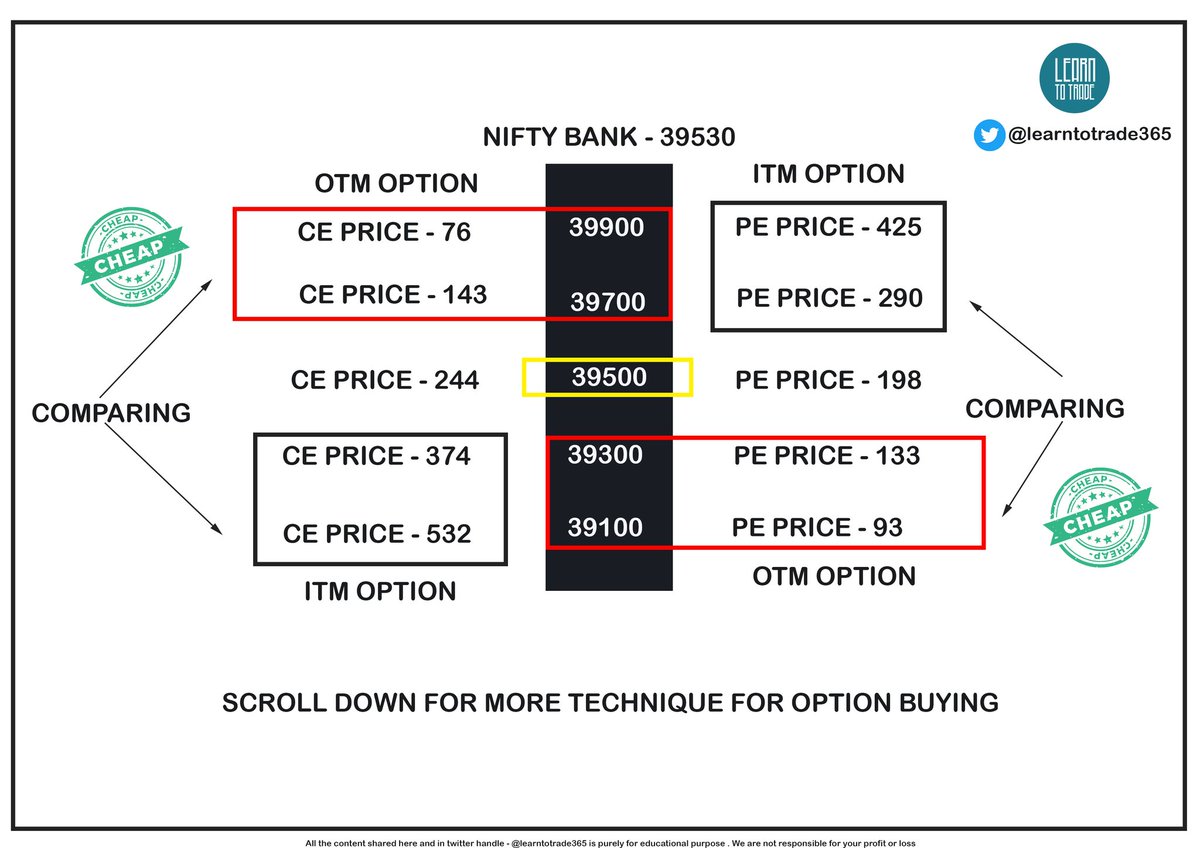
A thread on Basic Checklist while going Long Options.
— Asit Baran Pati \U0001f1ee\U0001f1f3 (@asitbaran) May 24, 2021
Thought of writing this post for people who are doing Option Buying and losing money. It can be very basic, so Pros please may give a skip.
Just a checklist so that you don\u2019t lose big money by Long Option strategies
The best spreads trader on Twitter: @Ronak_Unadkat
— Aditya Todmal (@AdityaTodmal) March 6, 2022
He trades in Nifty & Bank Nifty via spreads majorly.
In the Jainam Broking Speech, he shared how he trades debit and credit spreads:
Here's a breakdown of his 10 step method: \U0001f9f5
Collaborated with @niki_poojary
A THREAD on . . . .
— Aditya Todmal (@AdityaTodmal) March 29, 2021
How @ITRADE191 selects strikes to trade in and how he follows risk management.
Short thread explained via pictures with the help of @niki_poojary.
2 hours of non-stop Twitter space by @kapildhama
— Learn to Trade (@learntotrade365) January 17, 2022
Topic - Data Points to check as a Option seller
Mega Thread \U0001f9f5 of all the data points to check as a option seller shared by Mr. Kapil Dhama is complied
Retweet to reach wider -Learning should never stop#StockMarketindia
1/18 https://t.co/m0NXToSU1p pic.twitter.com/GkjArctHsR
Happy Independence day to everyone
— Learn to Trade (@learntotrade365) August 15, 2022
Real independence is spreading positivity, staying calm & always be happy in up & down pic.twitter.com/5J5eXTiJgJ