
you can place two type of stoploss orders one is SL-Market & SL-limit
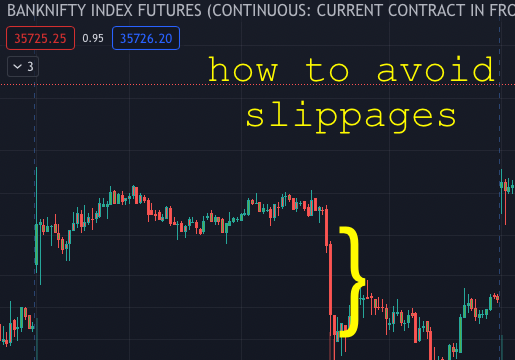
stoploss & slippages : a thread to understand how to avoid big slippage when you get stopped out #Qunat #AlgoTradeing #Nifty #stoploss (p.s. this is just an effort to educate & example is for illustration only.) hope this helps.
you can place two type of stoploss orders one is SL-Market & SL-limit
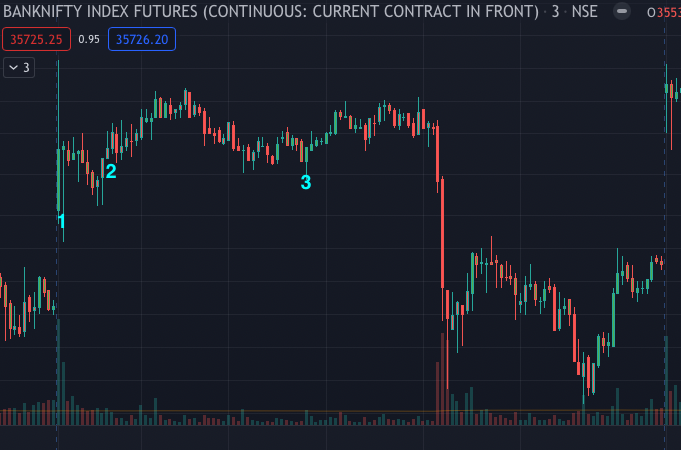
ex. 1) 9:20 -> SL order trigger at 100 qty 500
2) 9:45 -> SL order with trigger at 100 qty 500
3) 11:30 -> SL order with trigger at 100.5 qty 500
for these ppl now panic kicks in and they convert Sl-limit to market and this 2nd push takes prices even lower
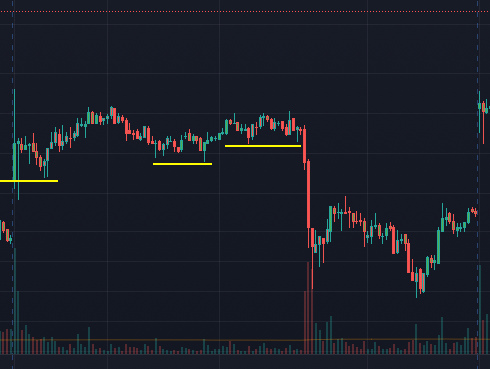
1. keeping trigger at higher level avoid round prices like 100, 110, so if your swing low if at 102 most ppl keep SL trriger at 101 or 99 to be on safe side ..
so instead for waiting for confirmation 1st place your SL order on signal (you need to calculate your RR on this price)
now on confirmation place your buy order.
Trading in large quantities, want to reduce slippages?
— Jitendra Jain (@jitendrajain) June 10, 2021
A small document on how to reduce slippages.
Will keep adding points.
Made with help from @TraderLogical
Also inputs by @JigneshTrade ,@pavankulkarni & @QuantKarnage https://t.co/rAVJDnznpL
Any Inputs?
Do Retweet
More from Stockslearnings


🧵Top 20 best tweets of the week: 30th Oct 🧵
Thread's on:
• How to find targets and exit criteria?
• Shanon's Demon (Investing)
• Tradingview scanner- Intraday/BTST
• 90-degree angle inflection point for profit-booking
• Importance of Leverage
Other cool tweets as well.
🧵Shannon's Demon - an investing "thought exercise"
This account writes the best threads, if you like the threads I make, you will surely love this account. Must
🧵Finding expected targets and exit criteria to look for to exit the
🧵Trading View Scanner process to trade in momentum stocks.
🧵90-degree angle inflection point for
Thread's on:
• How to find targets and exit criteria?
• Shanon's Demon (Investing)
• Tradingview scanner- Intraday/BTST
• 90-degree angle inflection point for profit-booking
• Importance of Leverage
Other cool tweets as well.
🧵Shannon's Demon - an investing "thought exercise"
This account writes the best threads, if you like the threads I make, you will surely love this account. Must
1/
— 10-K Diver (@10kdiver) October 23, 2021
Get a cup of coffee.
In this thread, I'll walk you through Shannon's Demon.
This is an investing "thought exercise" -- posed by the great scientist Claude Shannon.
Solving this exercise can teach us a lot about favorable vs unfavorable long-term bets, position sizing, etc.
🧵Finding expected targets and exit criteria to look for to exit the
How to find out the expected targets and what should be the exit criteria when you enter a trade - \U0001f9f5
— Sheetal Rijhwani (@RijhwaniSheetal) October 25, 2021
Possible ways to find out the target:
Check if any patterns forming - it gets quite easy to figure out the targets that way. (1/15)
🧵Trading View Scanner process to trade in momentum stocks.
Trading view scanner process -
— Vikrant (@Trading0secrets) October 23, 2021
1 - open trading view in your browser and select stock scanner in left corner down side .
2 - touch the percentage% gain change ( and u can see higest gainer of today) https://t.co/GGWSZXYMth
🧵90-degree angle inflection point for
The 90 degree angle inflection point in a stock is a signal to book profit
— Nikita Poojary (@niki_poojary) October 24, 2021
Lets understand with a recent example of a stock #IRCTC \U0001f683\U0001f68b
Time for a thread\U0001f9f5


You May Also Like


1/Politics thread time.
To me, the most important aspect of the 2018 midterms wasn't even about partisan control, but about democracy and voting rights. That's the real battle.
2/The good news: It's now an issue that everyone's talking about, and that everyone cares about.
3/More good news: Florida's proposition to give felons voting rights won. But it didn't just win - it won with substantial support from Republican voters.
That suggests there is still SOME grassroots support for democracy that transcends
4/Yet more good news: Michigan made it easier to vote. Again, by plebiscite, showing broad support for voting rights as an
5/OK, now the bad news.
We seem to have accepted electoral dysfunction in Florida as a permanent thing. The 2000 election has never really
Bad ballot design led to a lot of undervotes for Bill Nelson in Broward Co., possibly even enough to cost him his Senate seat. They do appear to be real undervotes, though, instead of tabulation errors. He doesn't really seem to have a path to victory. https://t.co/utUhY2KTaR
— Nate Silver (@NateSilver538) November 16, 2018

@franciscodeasis https://t.co/OuQaBRFPu7
Unfortunately the "This work includes the identification of viral sequences in bat samples, and has resulted in the isolation of three bat SARS-related coronaviruses that are now used as reagents to test therapeutics and vaccines." were BEFORE the

chimeric infectious clone grants were there.https://t.co/DAArwFkz6v is in 2017, Rs4231.
https://t.co/UgXygDjYbW is in 2016, RsSHC014 and RsWIV16.
https://t.co/krO69CsJ94 is in 2013, RsWIV1. notice that this is before the beginning of the project
starting in 2016. Also remember that they told about only 3 isolates/live viruses. RsSHC014 is a live infectious clone that is just as alive as those other "Isolates".
P.D. somehow is able to use funds that he have yet recieved yet, and send results and sequences from late 2019 back in time into 2015,2013 and 2016!
https://t.co/4wC7k1Lh54 Ref 3: Why ALL your pangolin samples were PCR negative? to avoid deep sequencing and accidentally reveal Paguma Larvata and Oryctolagus Cuniculus?
Unfortunately the "This work includes the identification of viral sequences in bat samples, and has resulted in the isolation of three bat SARS-related coronaviruses that are now used as reagents to test therapeutics and vaccines." were BEFORE the
chimeric infectious clone grants were there.https://t.co/DAArwFkz6v is in 2017, Rs4231.
https://t.co/UgXygDjYbW is in 2016, RsSHC014 and RsWIV16.
https://t.co/krO69CsJ94 is in 2013, RsWIV1. notice that this is before the beginning of the project
starting in 2016. Also remember that they told about only 3 isolates/live viruses. RsSHC014 is a live infectious clone that is just as alive as those other "Isolates".
P.D. somehow is able to use funds that he have yet recieved yet, and send results and sequences from late 2019 back in time into 2015,2013 and 2016!
https://t.co/4wC7k1Lh54 Ref 3: Why ALL your pangolin samples were PCR negative? to avoid deep sequencing and accidentally reveal Paguma Larvata and Oryctolagus Cuniculus?

