
https://t.co/ipQ7Y0JCnG
1/Politics thread time.
To me, the most important aspect of the 2018 midterms wasn't even about partisan control, but about democracy and voting rights. That's the real battle.
https://t.co/ipQ7Y0JCnG
That suggests there is still SOME grassroots support for democracy that transcends partisanship.
https://t.co/jHHieSkzTg
https://t.co/ffEwTP2SPq
We seem to have accepted electoral dysfunction in Florida as a permanent thing. The 2000 election has never really ended.
https://t.co/auFaCR7WvH
Bad ballot design led to a lot of undervotes for Bill Nelson in Broward Co., possibly even enough to cost him his Senate seat. They do appear to be real undervotes, though, instead of tabulation errors. He doesn't really seem to have a path to victory. https://t.co/utUhY2KTaR
— Nate Silver (@NateSilver538) November 16, 2018
The big worry is that it functioned as a trial balloon.
https://t.co/qcPP0wGGDR
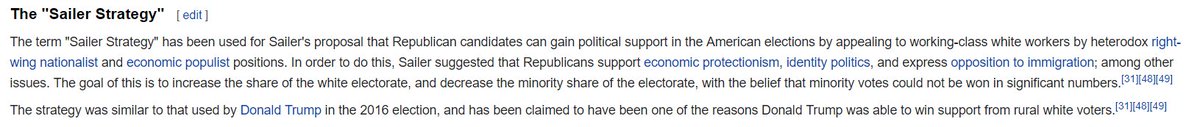
The GOP abandoned hope of winning over nonwhite voters, and went with the "Sailer Strategy": https://t.co/jBH0K4JUv4 …
Which is why voting rights have become such a central issue.
It's about breaking the Sailer Strategy, and putting to bed the idea that electioneering can make nonwhite voters disappear.
https://t.co/p3vGgC3A1D
DAAAAAAAAAAAAAAMN pic.twitter.com/hdZzNEvsjG
— Noah Smith (@Noahpinion) November 15, 2018
More from Noah Smith
Time for panel #3: Big Tech and regulation!
I will be live-tweeting again, and you can also watch video at either the Twitter or Facebook links below!
Kaissar: Every industry gets regulated when it gets big. The question is what kind of regulation Big Tech will get,and whether the companies will be proactive in shaping it.
Kaissar: More profitable companies have higher returns. Why? Maybe it's a risk factor, because more profit = higher risk of getting regulated.
Bershidskyis showing a diagram of GDPR complaince pop-ups. What a massive ill-conceived bureaucratic mess.
Ritholtz: It's 2018 and we're still talking about Facebook privacy settings?! If you're still giving your personal data to Facebook, you just don't care about privacy!
I will be live-tweeting again, and you can also watch video at either the Twitter or Facebook links below!
Bloomberg Ideas conference now starting! I will be live-tweeting it. You can watch on our Facebook or Twitter pages (links below)! https://t.co/Mbr9dZzWBy
— Noah Smith (@Noahpinion) October 25, 2018
Kaissar: Every industry gets regulated when it gets big. The question is what kind of regulation Big Tech will get,and whether the companies will be proactive in shaping it.
Kaissar: More profitable companies have higher returns. Why? Maybe it's a risk factor, because more profit = higher risk of getting regulated.
Bershidskyis showing a diagram of GDPR complaince pop-ups. What a massive ill-conceived bureaucratic mess.
Ritholtz: It's 2018 and we're still talking about Facebook privacy settings?! If you're still giving your personal data to Facebook, you just don't care about privacy!
Bloomberg Ideas conference now starting! I will be live-tweeting it. You can watch on our Facebook or Twitter pages (links below)!
Our first panel is about cryptocurrency! We have @matt_levine, @tylercowen, @eiaine, @nirkaissar, and Camilla
Ou: Crypto will be useful for the unbanked.
Cowen: Crypto has to compete against a bunch of other emerging payments technologies. Bitcoin is too inflexible.
Cowen: I'll bet on the payments companies over crypto.
Today and tomorrow we'll be having a Bloomberg Ideas event!
— Noah Smith (@Noahpinion) October 25, 2018
Today will be a panel on cryptocurrency.
Tomorrow will be panels on the economics of AI, and on regulation of big tech companies.
You can watch livestreams here:https://t.co/1dC0ELGvabhttps://t.co/Juz5Mp2EC1 pic.twitter.com/VfxOscNflo
Our first panel is about cryptocurrency! We have @matt_levine, @tylercowen, @eiaine, @nirkaissar, and Camilla
Ou: Crypto will be useful for the unbanked.
Cowen: Crypto has to compete against a bunch of other emerging payments technologies. Bitcoin is too inflexible.
Cowen: I'll bet on the payments companies over crypto.
More from Politics


You May Also Like


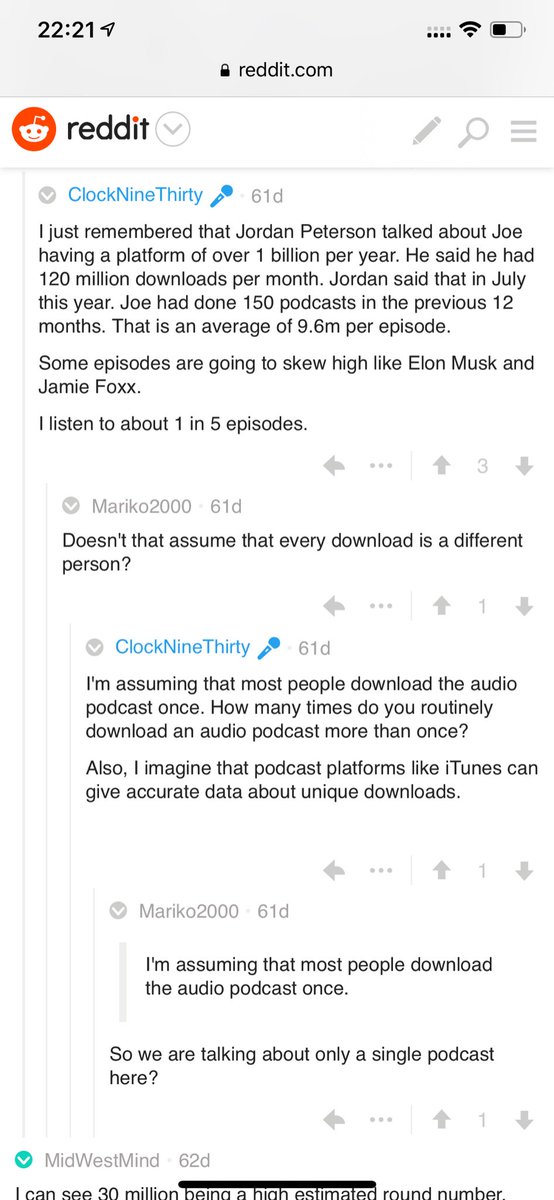
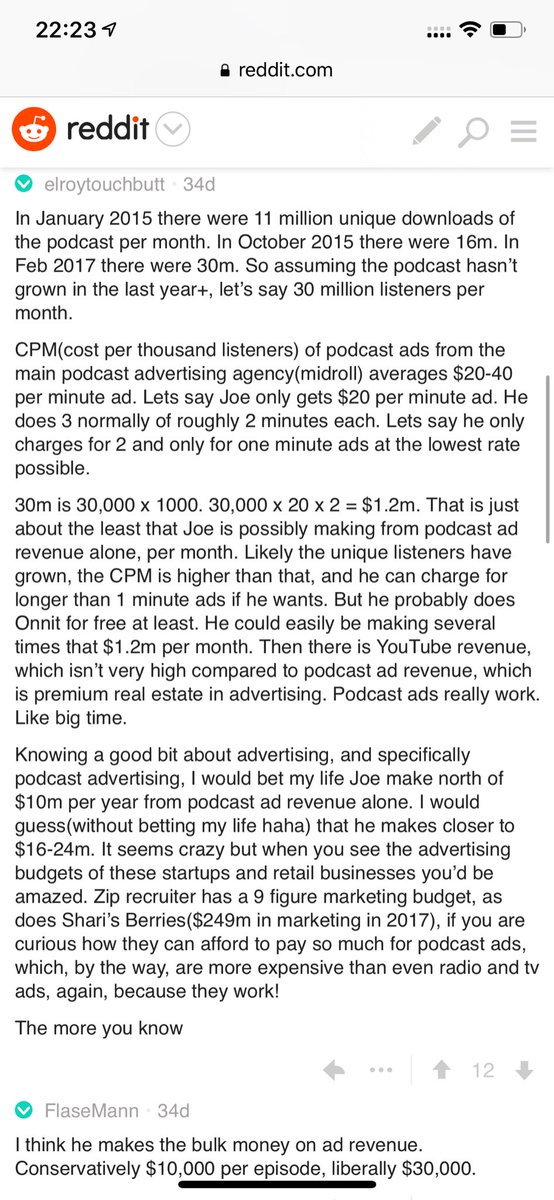
Joe Rogan's podcast is now is listened to 1.5+ billion times per year at around $50-100M/year revenue.
Independent and 100% owned by Joe, no networks, no middle men and a 100M+ people audience.
👏
https://t.co/RywAiBxA3s
Joe is the #1 / #2 podcast (depends per week) of all podcasts
120 million plays per month source https://t.co/k7L1LfDdcM
https://t.co/aGcYnVDpMu
Independent and 100% owned by Joe, no networks, no middle men and a 100M+ people audience.
👏
https://t.co/RywAiBxA3s
Joe is the #1 / #2 podcast (depends per week) of all podcasts
120 million plays per month source https://t.co/k7L1LfDdcM
https://t.co/aGcYnVDpMu


A list of cool websites you might now know about
A thread 🧵
1) Learn Anything - Search tools for knowledge discovery that helps you understand any topic through the most efficient
2) Grad Speeches - Discover the best commencement speeches.
This website is made by me
3) What does the Internet Think - Find out what the internet thinks about anything
4) https://t.co/vuhT6jVItx - Send notes that will self-destruct after being read.