1/n I have not seen a single 2 - 3 day position trading system which is as simple as this. Experts will say RSi not applicable in 15 min time frame, I say first understand the the calculation of RSI :-). no need of scanner.
just discipline and risk mgmnt
#RSI #divergence

2/n: System as explained before:
4 step process
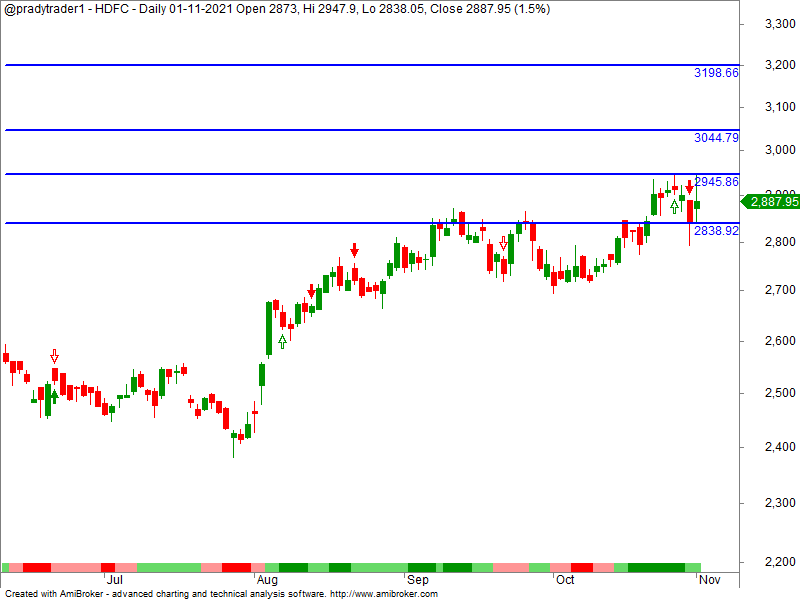
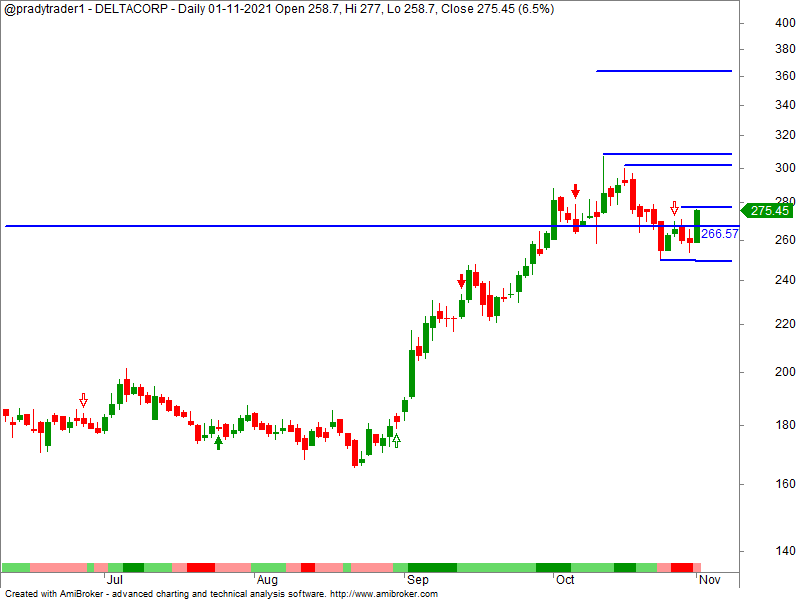
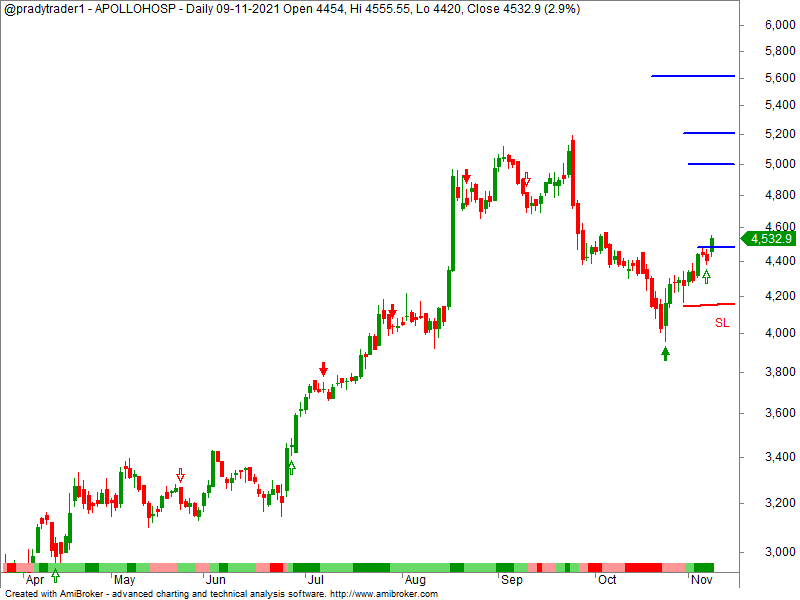
1. Identify stock from EOD chart
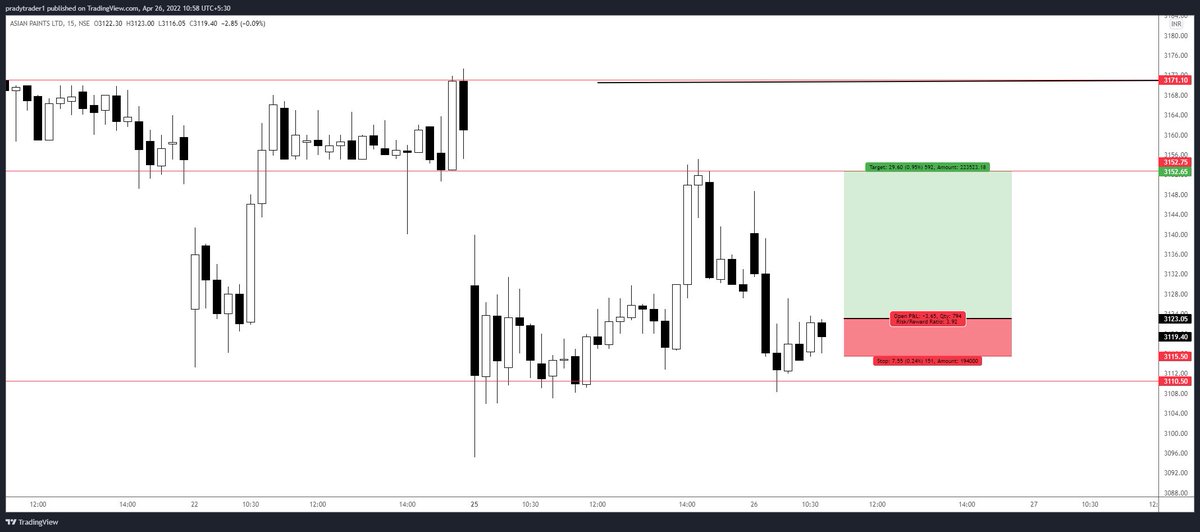
2. Look for RSI Divergence in 15 minutes
3. Wait for Consolidation and range break.
Trade in the direction of break.
4. Trail for at least 1:3 RR or SL.
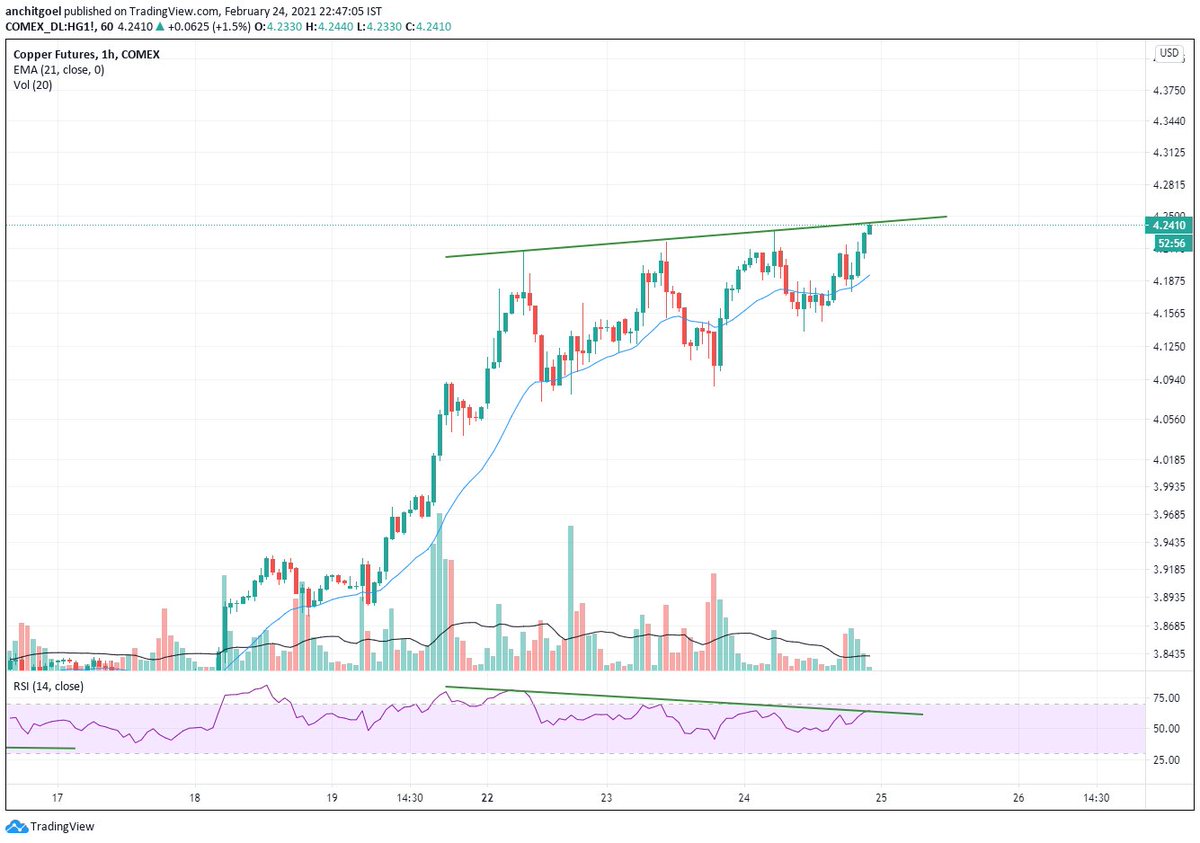
3/n: Had posted last week about weak EOD chart of MnM. See what happened this week despite the fact that the overall market was bullish.
It is a zero loss trade now.
Invest in yourself. No guru can make you a successful trader. #hardwork #discipline
4/n: there are many more examples of this if you see my timeline. it works across markets even in bitcoin lol!
Keep it simple. Trick is always in the risk reward and position sizing.
Must only take trades which have minimum 1:3 RR.
Do not use excessive #leverage.
5/5: Charlie Munger: “If you’re smart you don’t need leverage; if you’re dumb, it will ruin you.”
Cant put it better as I have been on both sides :-)

Tamasoma Jyotirgamayah!
#weekend #learn #trade #success

More from pradytrader🎯💉🥋

More from Stockslearnings

🌟Lesson 1 - weekly /monthly breakout push stock price 30/50% higher in 2/3 weeks.

Ex- #sastasundar after breakout 145/155 zone , stocks in 2/3 weeks given 30/40% return.

And in 2/3 months it was double 💞 https://t.co/9kkc3IV4Lo


🌟Lesson 2 - if stock is making same pattern ( in 2 /3hours chart) after given breakout of (weekly /monthly chart) , then chances of stock going up is much more.

Ex - #HGS after given breakout of Trendline ( range) in monthly chart, again making same pattern 4 hours chart. 💞


🌟Lesson 3- if stock never come to retest it's weekly & monthly breakout zone then the chances of it's 2x is much more.

EX - #happiestmind everytime consolidating & making new high. 💞

@chartmojo
@charts_breakout


🌟Lesson 4 - when whole market fall still strongest stocks only consolidate or move down very little.

Ex - when this march market took correction 800/1000 points #jindalpoly just consolidating from that time.
Now ready for new high . 💞


🌟Lesson 5 - when market recover the strongest stocks recover very fast & will make new high.
Ex - #happiestmind when market take little correction & again bounce little , then #happiestmind made new high before market .

You May Also Like

THE MEANING, SIGNIFICANCE AND HISTORY OF SWASTIK

The Swastik is a geometrical figure and an ancient religious icon. Swastik has been Sanatan Dharma’s symbol of auspiciousness – mangalya since time immemorial.


The name swastika comes from Sanskrit (Devanagari: स्वस्तिक, pronounced: swastik) &denotes “conducive to wellbeing or auspicious”.
The word Swastik has a definite etymological origin in Sanskrit. It is derived from the roots su – meaning “well or auspicious” & as meaning “being”.


"सु अस्ति येन तत स्वस्तिकं"
Swastik is de symbol through which everything auspicios occurs

Scholars believe word’s origin in Vedas,known as Swasti mantra;

"🕉स्वस्ति ना इन्द्रो वृधश्रवाहा
स्वस्ति ना पूषा विश्ववेदाहा
स्वस्तिनास्तरक्ष्यो अरिश्तनेमिही
स्वस्तिनो बृहस्पतिर्दधातु"


It translates to," O famed Indra, redeem us. O Pusha, the beholder of all knowledge, redeem us. Redeem us O Garudji, of limitless speed and O Bruhaspati, redeem us".

SWASTIK’s COSMIC ORIGIN

The Swastika represents the living creation in the whole Cosmos.


Hindu astronomers divide the ecliptic circle of cosmos in 27 divisions called
https://t.co/sLeuV1R2eQ this manner a cross forms in 4 directions in the celestial sky. At centre of this cross is Dhruva(Polestar). In a line from Dhruva, the stars known as Saptarishi can be observed.
Ivor Cummins has been wrong (or lying) almost entirely throughout this pandemic and got paid handsomly for it.

He has been wrong (or lying) so often that it will be nearly impossible for me to track every grift, lie, deceit, manipulation he has pulled. I will use...


... other sources who have been trying to shine on light on this grifter (as I have tried to do, time and again:


Example #1: "Still not seeing Sweden signal versus Denmark really"... There it was (Images attached).
19 to 80 is an over 300% difference.

Tweet: https://t.co/36FnYnsRT9


Example #2 - "Yes, I'm comparing the Noridcs / No, you cannot compare the Nordics."

I wonder why...

Tweets: https://t.co/XLfoX4rpck / https://t.co/vjE1ctLU5x


Example #3 - "I'm only looking at what makes the data fit in my favour" a.k.a moving the goalposts.

Tweets: https://t.co/vcDpTu3qyj / https://t.co/CA3N6hC2Lq