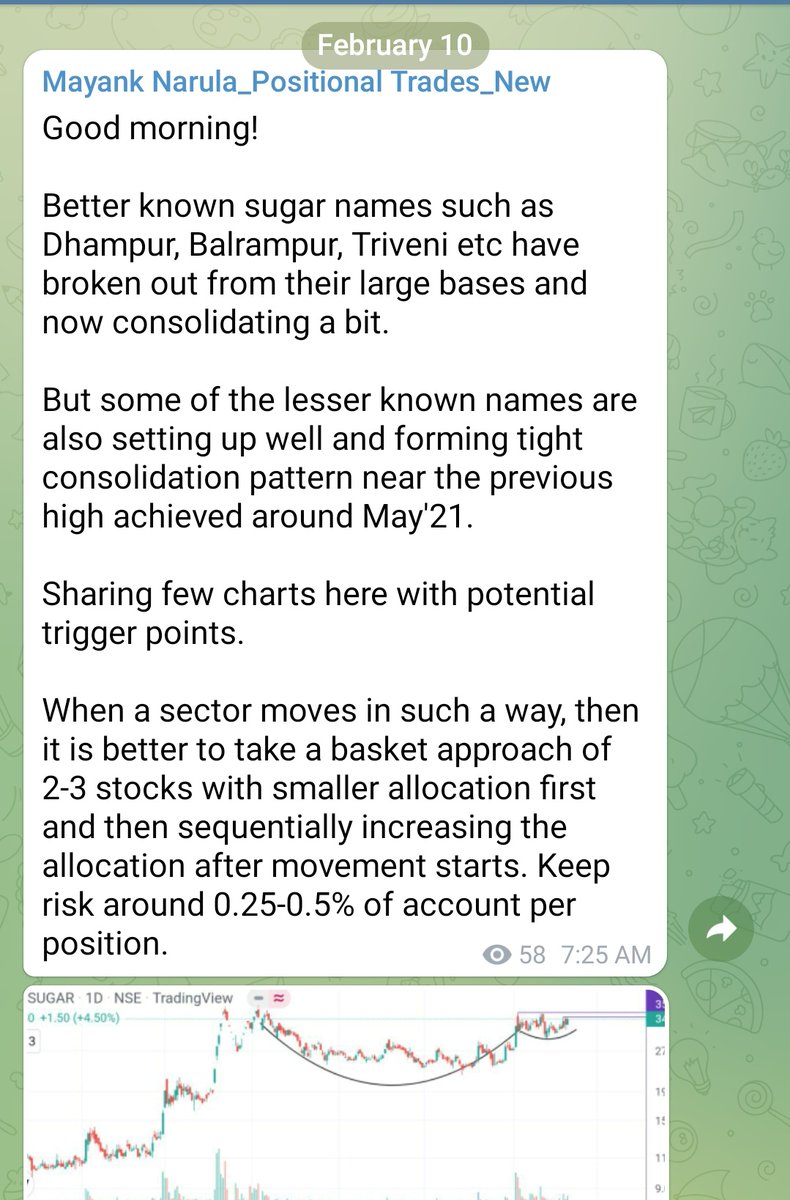
#SUGAR
Shared this update on sugar stocks in Feb on telegram.
Some of them have moved a bit but this is just the beginning.
Way sugar is setting up, it can very well replicate pharma rally of 2020.
However, looks extended on smaller tf. Will wait here for some retracement.
More from Mayank Narula

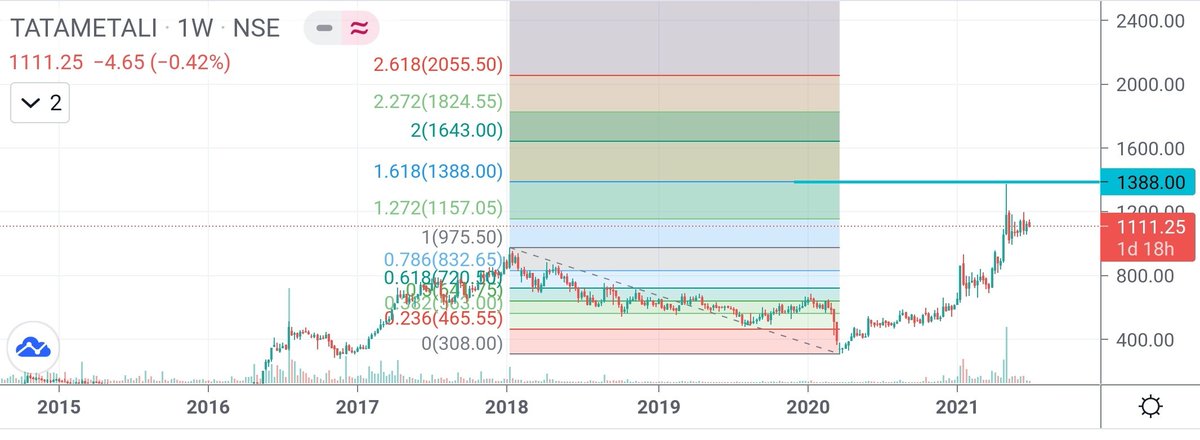
#Nifty
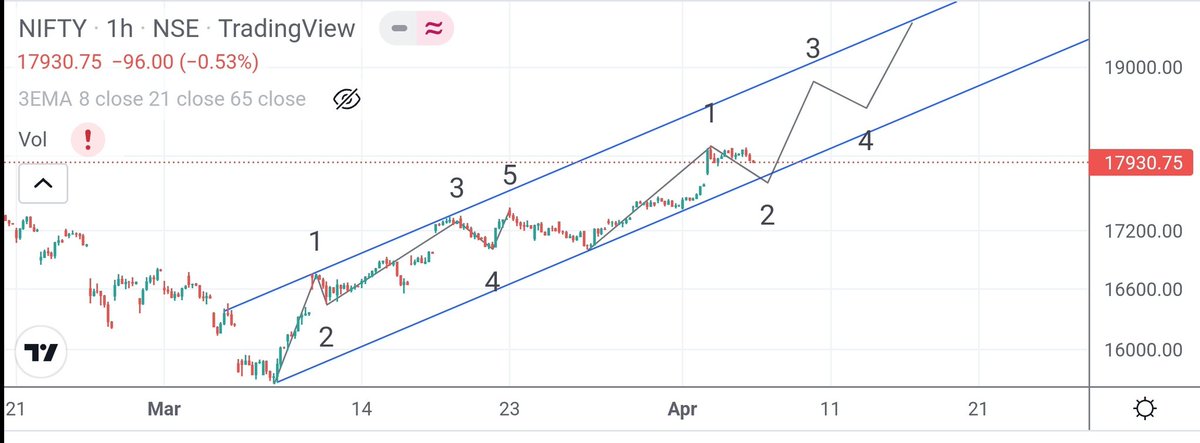
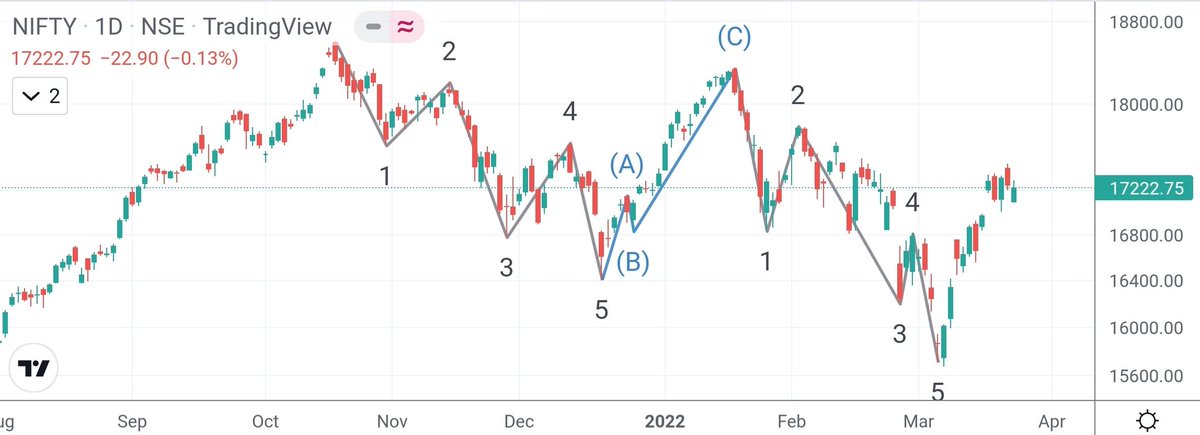
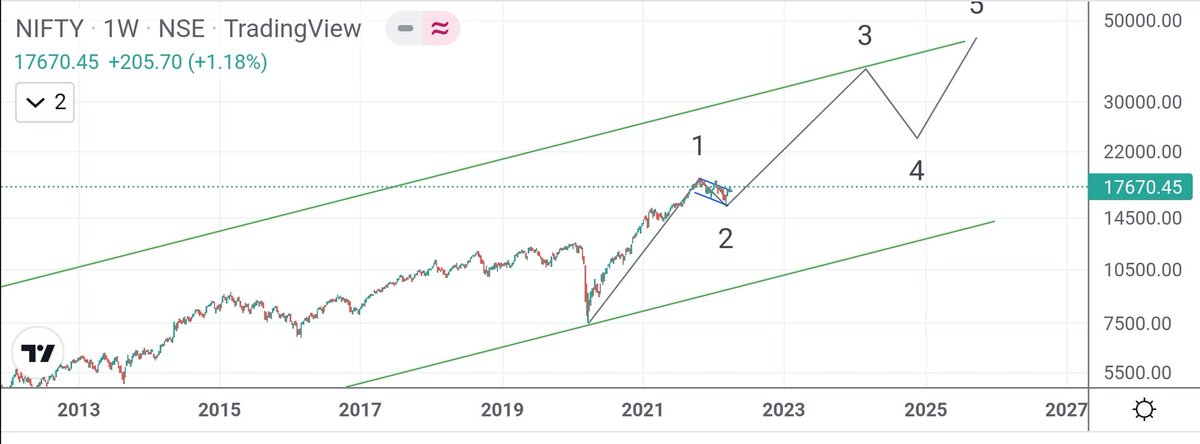
So now that Nifty has undergone ABC correction in the expected manner, what to expect next?
I think we have started larger degree wave 3, once 16800 was crossed.
16800 is the reference level now. We will get more sense by end of next week/ month. https://t.co/KsziuUpZxU
#NIFTY
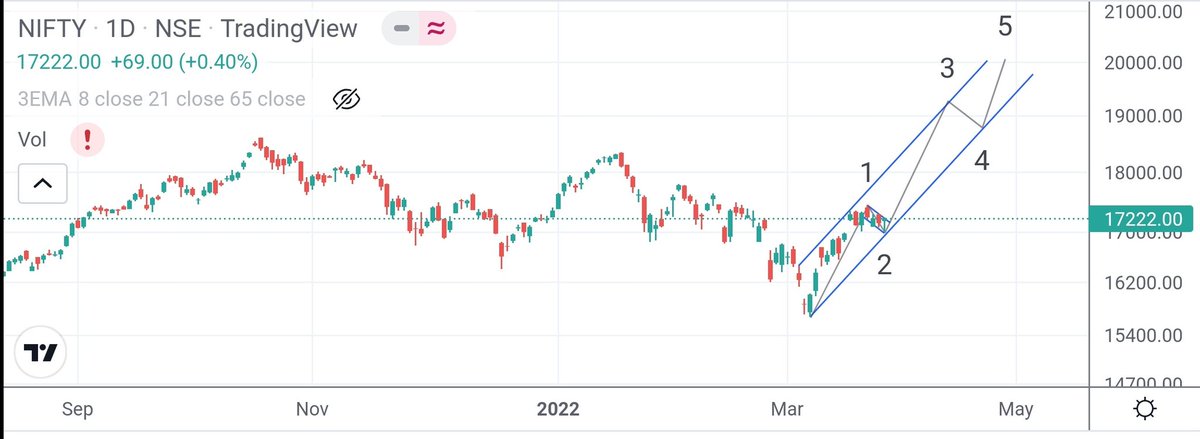
If 17445 is taken out, then may be we are heading to fresh new all time on Nifty.
Things may pan out way faster than expected.
#NIFTY
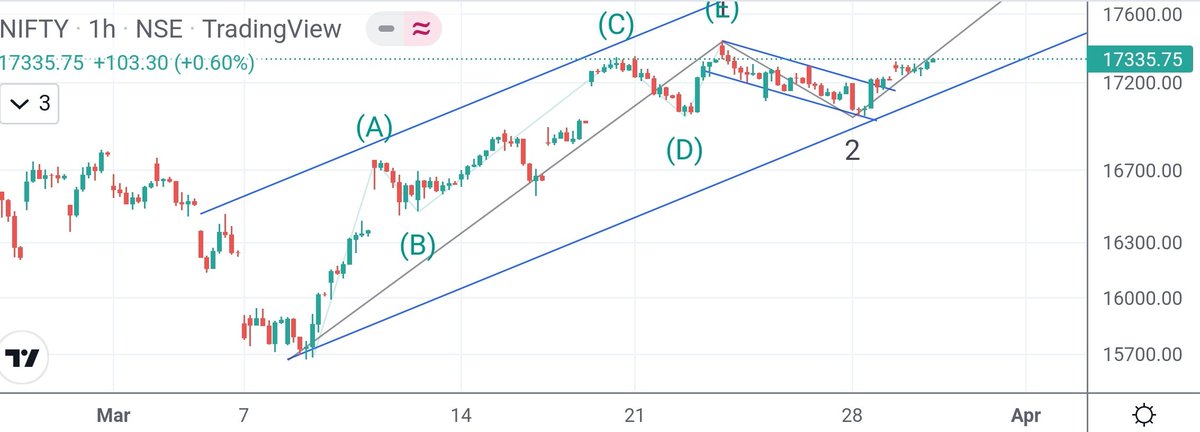
Zoomed in cross-section of the chart above.
Wave 3 of 1 should have started today, which can take Nifty to fresh all time highs.
#NIFTY
So now Nifty is moving more clearly on the expected path, what's next?
Nifty has started longer term wave 3 advancement, pending final confirmation of HH by crossing 17800.
In Wave 1 of 3, can expect a move to 20k+.
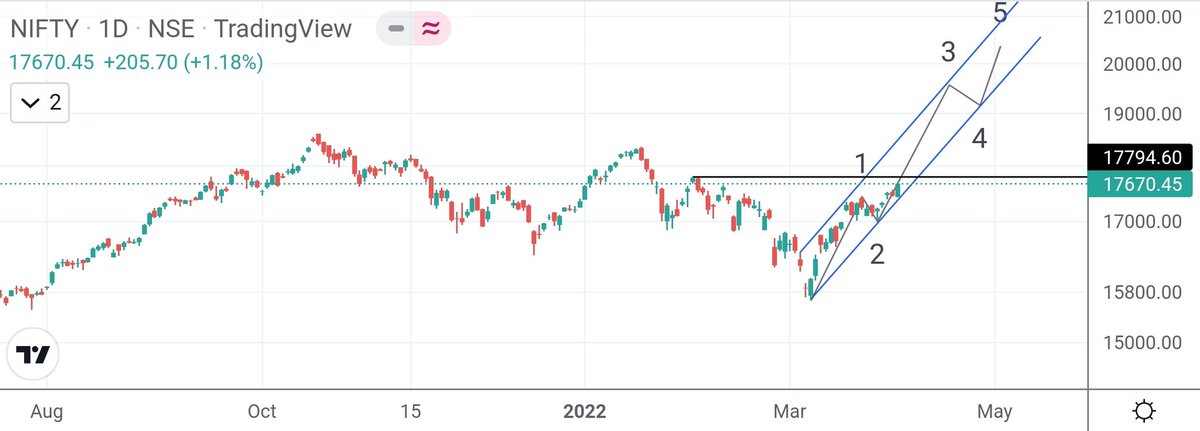
In terms of longer term wave structure:
Wave 1: 7500 to 18600
Wave 3: 15700 to 35000+
And this can pan out over next 2 years or so.
Since wave 2 was a shallow correction, wave 4 can potentially be a deeper correction.
So now that Nifty has undergone ABC correction in the expected manner, what to expect next?
I think we have started larger degree wave 3, once 16800 was crossed.
16800 is the reference level now. We will get more sense by end of next week/ month. https://t.co/KsziuUpZxU
I am no expert in Wave Theory, but can this be a possible path over next few weeks/months?
— Mayank Narula (@Mayank_Narula1) December 6, 2021
Views requested. @idineshptl @indiacharts @nishkumar1977 pic.twitter.com/u3DjEeqoqB
#NIFTY
If 17445 is taken out, then may be we are heading to fresh new all time on Nifty.
Things may pan out way faster than expected.
#NIFTY
Zoomed in cross-section of the chart above.
Wave 3 of 1 should have started today, which can take Nifty to fresh all time highs.
#NIFTY
So now Nifty is moving more clearly on the expected path, what's next?
Nifty has started longer term wave 3 advancement, pending final confirmation of HH by crossing 17800.
In Wave 1 of 3, can expect a move to 20k+.
In terms of longer term wave structure:
Wave 1: 7500 to 18600
Wave 3: 15700 to 35000+
And this can pan out over next 2 years or so.
Since wave 2 was a shallow correction, wave 4 can potentially be a deeper correction.
More from Sugar





You May Also Like


1/OK, data mystery time.
This New York Times feature shows China with a Gini Index of less than 30, which would make it more equal than Canada, France, or the Netherlands. https://t.co/g3Sv6DZTDE
That's weird. Income inequality in China is legendary.
Let's check this number.
2/The New York Times cites the World Bank's recent report, "Fair Progress? Economic Mobility across Generations Around the World".
The report is available here:
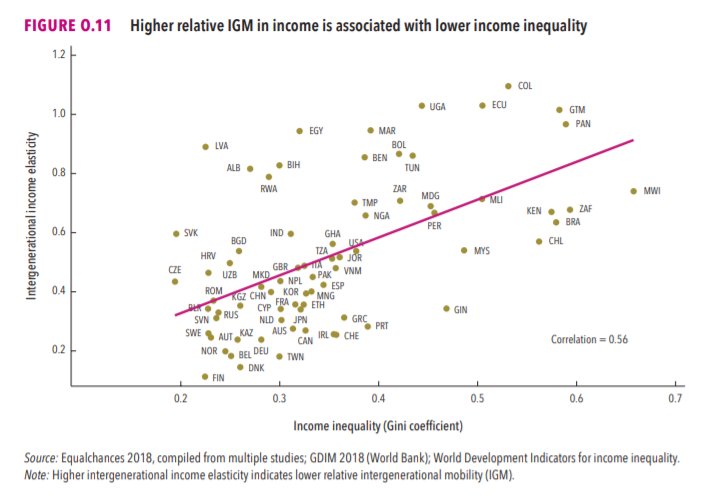
3/The World Bank report has a graph in which it appears to show the same value for China's Gini - under 0.3.
The graph cites the World Development Indicators as its source for the income inequality data.
4/The World Development Indicators are available at the World Bank's website.
Here's the Gini index: https://t.co/MvylQzpX6A
It looks as if the latest estimate for China's Gini is 42.2.
That estimate is from 2012.
5/A Gini of 42.2 would put China in the same neighborhood as the U.S., whose Gini was estimated at 41 in 2013.
I can't find the <30 number anywhere. The only other estimate in the tables for China is from 2008, when it was estimated at 42.8.
This New York Times feature shows China with a Gini Index of less than 30, which would make it more equal than Canada, France, or the Netherlands. https://t.co/g3Sv6DZTDE
That's weird. Income inequality in China is legendary.
Let's check this number.
2/The New York Times cites the World Bank's recent report, "Fair Progress? Economic Mobility across Generations Around the World".
The report is available here:
3/The World Bank report has a graph in which it appears to show the same value for China's Gini - under 0.3.
The graph cites the World Development Indicators as its source for the income inequality data.
4/The World Development Indicators are available at the World Bank's website.
Here's the Gini index: https://t.co/MvylQzpX6A
It looks as if the latest estimate for China's Gini is 42.2.
That estimate is from 2012.
5/A Gini of 42.2 would put China in the same neighborhood as the U.S., whose Gini was estimated at 41 in 2013.
I can't find the <30 number anywhere. The only other estimate in the tables for China is from 2008, when it was estimated at 42.8.