#PivotShiftIndicator
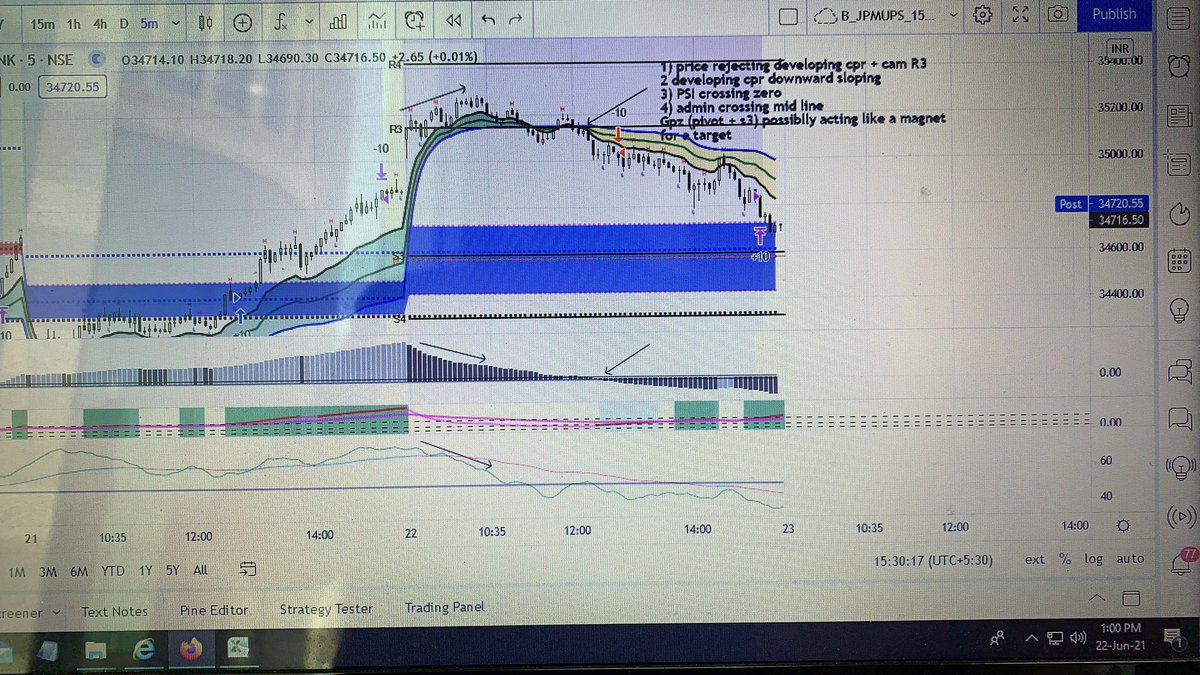
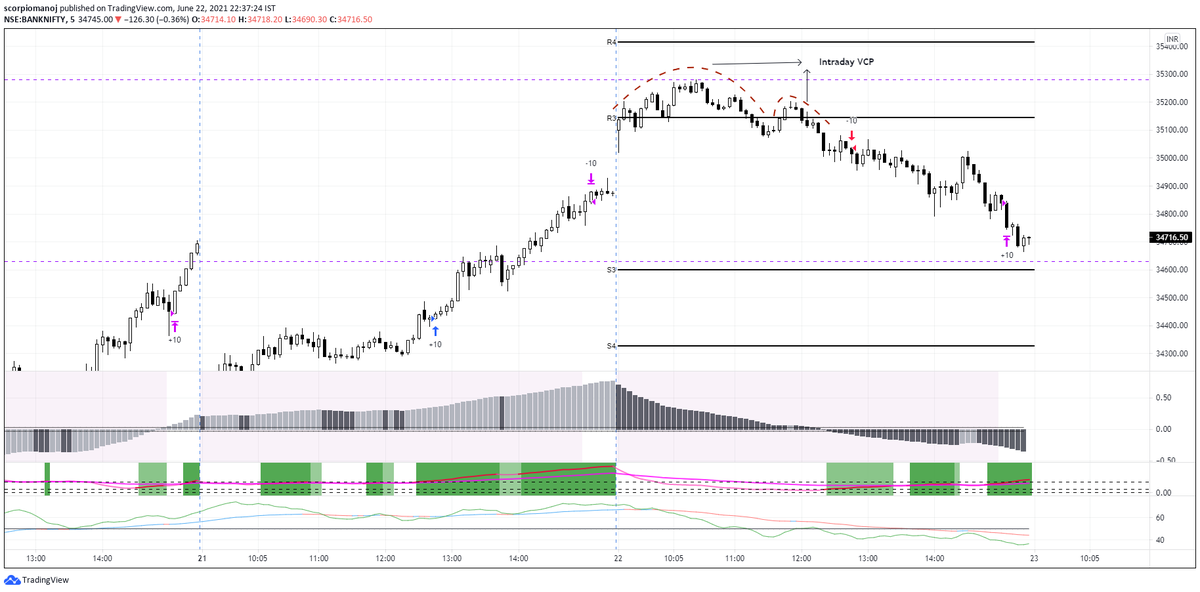
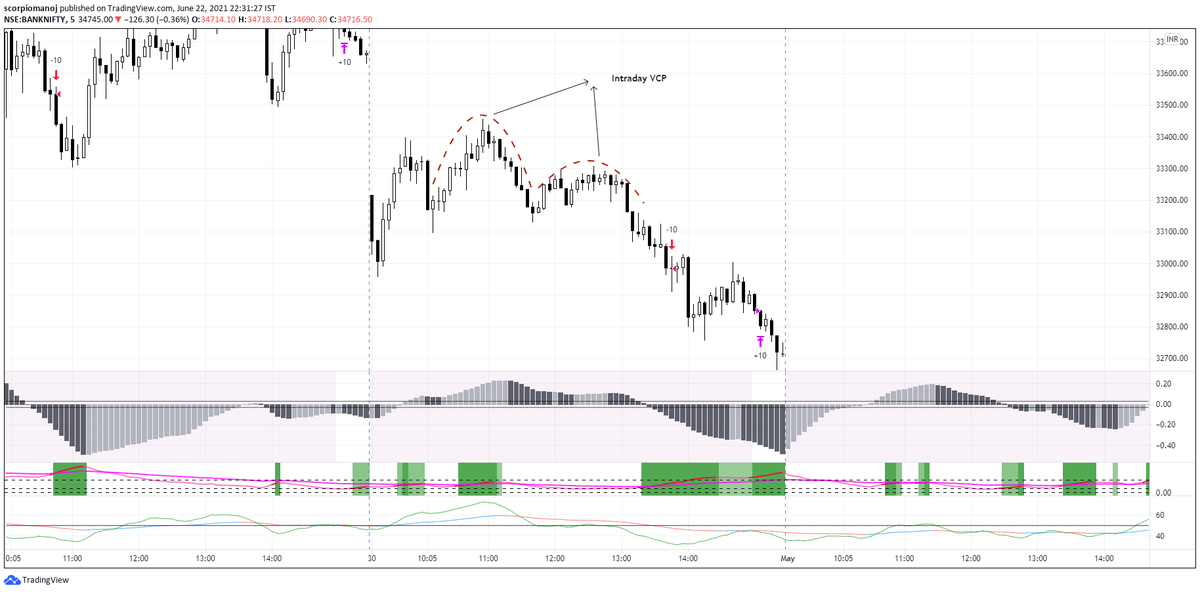
Those who followed this today would not have gone long in the open.
Both PSI and advance decline momentum were sloping downwards continuously even when the mkt gapped up and kept going up.Trollers might say this as post Mortem. But I made what I can... 😌.
More from HMK alias MANOJ
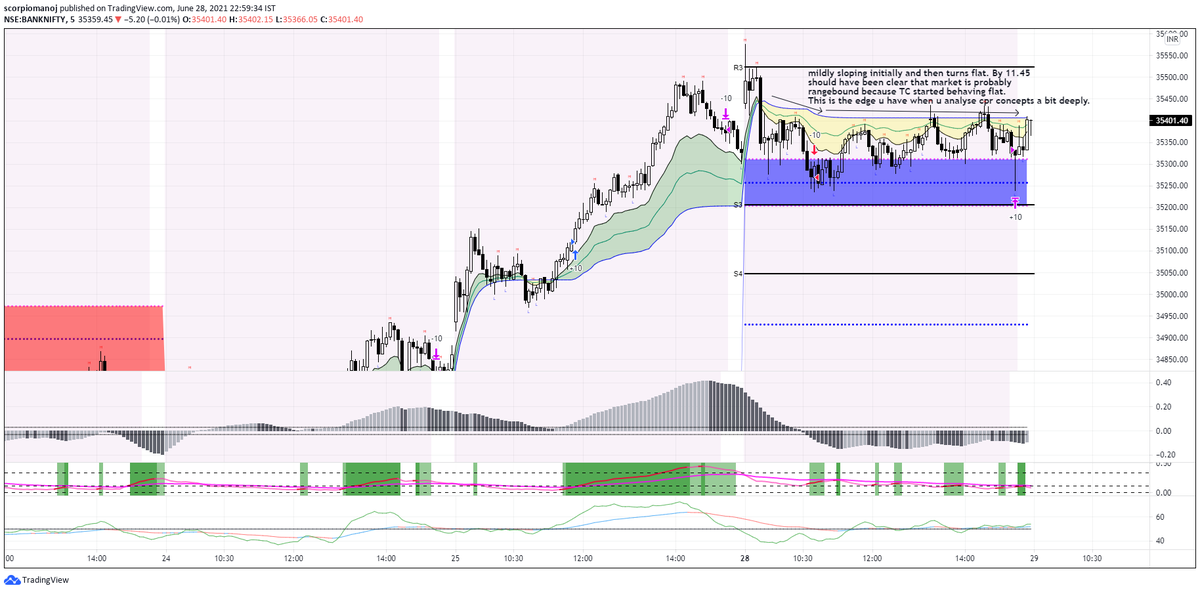
Today's move is an example of this tweet. Save this chart for future ref. https://t.co/amUhSLrET3
#FreeTip
— HMK alias MANOJ (@scorpiomanojFRM) June 23, 2021
A general rule to assess if a market is ranging is to look at developing TC and / or developing BC. If either of them is flat, it means market is currently ranging. If you are trading in 5 min, go to a lower tf chart, say, 2 min to have a less lagging assessment.
More from Stockslearnings




On this auspicious day of #GuruPoornima2020
— \u03b1\u043c\u03b9\u0442\u0442 \u0455\u03b1\u03b9\u03b7\u03b9 \U0001f1ee\U0001f1f3 (@heartwon) July 5, 2020
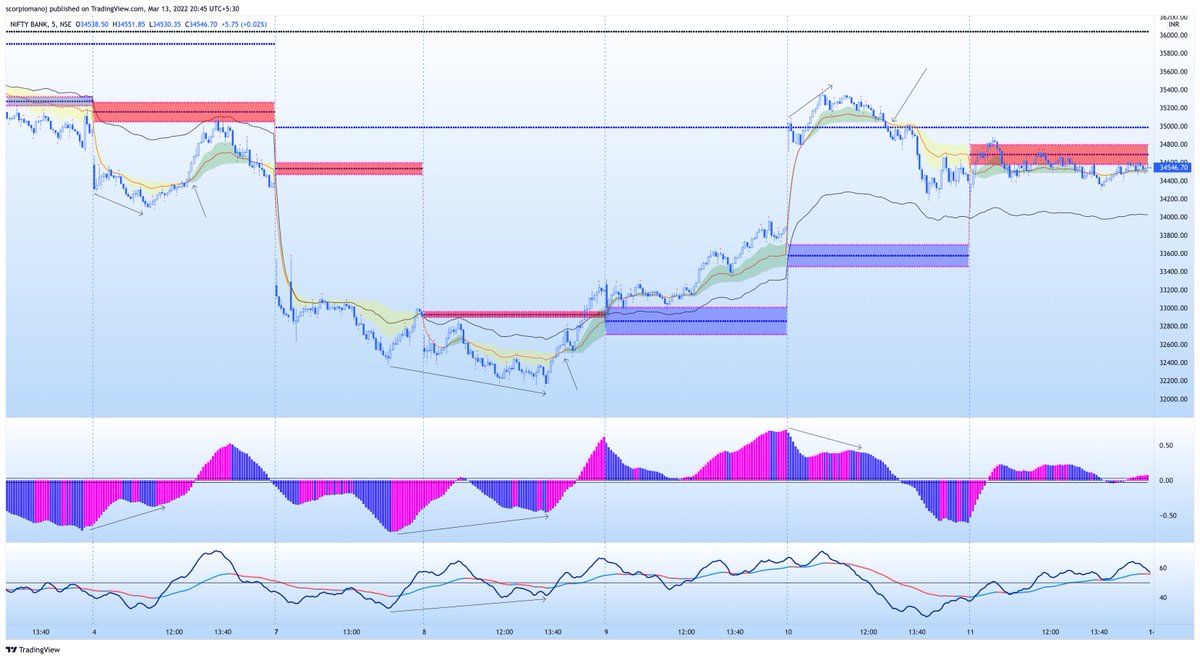
Would like to present a simple yet effective way of understanding and following the TREND of the instrument/stock.
Q: Why I came up with the concept?
A: I wanted to remove noise, keep my chart simple where just a glance, tells the story
Today's move is an example of this tweet. Save this chart for future ref. https://t.co/amUhSLrET3
#FreeTip
— HMK alias MANOJ (@scorpiomanojFRM) June 23, 2021
A general rule to assess if a market is ranging is to look at developing TC and / or developing BC. If either of them is flat, it means market is currently ranging. If you are trading in 5 min, go to a lower tf chart, say, 2 min to have a less lagging assessment.