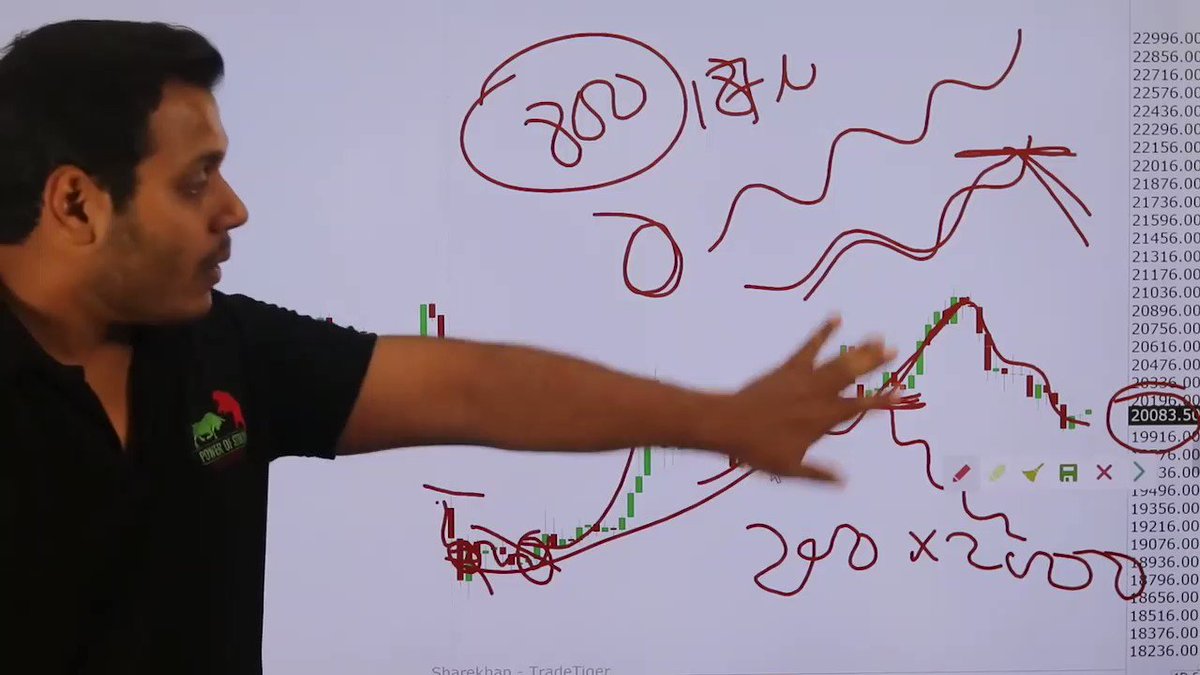
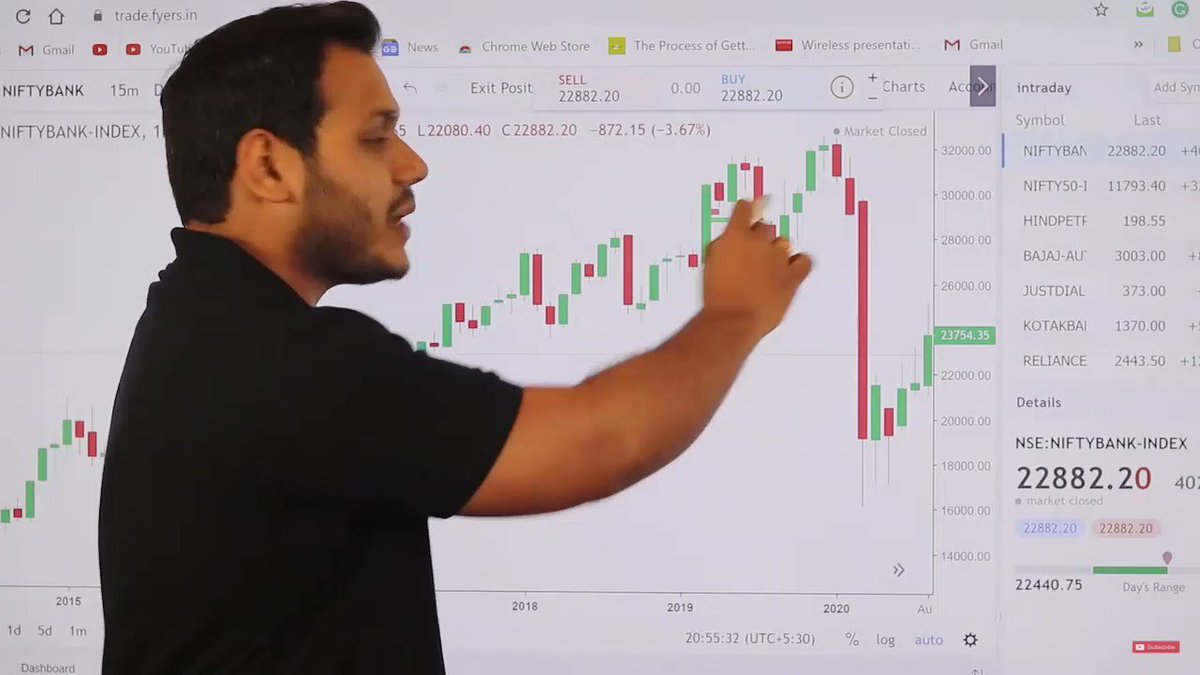
• Spot the U-turns i.e. the bend in the existing trend.
• He explains the change in the polarity concept here.


15 Learnings from Power of Stocks: \U0001f9f5
— Aditya Todmal (@AdityaTodmal) January 23, 2022
Collaborated with @niki_poojary
Twitter is like a free university.
— Aditya Todmal (@AdityaTodmal) July 1, 2022
However, 98.8 percent of users missed out on the best content on this platform.
Here are the top 26 threads from the past 26 weeks of 2022: \U0001f9f5
Collaborated with @niki_poojary
I started at 0 and grew to 109,000 followers
— Aditya Todmal (@AdityaTodmal) July 3, 2022
Here's how we use Twitter and why:
Collaborated with @niki_poojary
THREAD \U0001f9f5 \u2193
Subasish Pani revealed the most simple, yet successful strategy: 5EMA set up!
— Nikita Poojary (@niki_poojary) July 3, 2022
Here is a thread of 23 video clips on the 5EMA set-up that will save you hundreds of hours and available to you for no cost!
5EMA set-up: \U0001f9f5!
Collaborated with @AdityaTodmal
There are so many tools related to trading.
— Aditya Todmal (@AdityaTodmal) July 9, 2022
But very few provide any real value.
Here are 7 of the most valuable FREE Tools you're not using (but should be): \U0001f9f5
Collaborated with @niki_poojary
Short Straddle is the highest payoff strategy in Option Selling.
— Aditya Todmal (@AdityaTodmal) November 5, 2022
However, it comes with huge risks as well.
You become good at managing Straddles with adjustments.
Here's a step-by-step breakdown on them:
Collaborated with @niki_poojary
\U0001f9f5
Things I know now that I wish I knew three years ago when I started trading.
— Nikita Poojary (@niki_poojary) November 5, 2022
Collaborated with @AdityaTodmal
\U0001f9f5
How to use a corporate account to lower taxes drastically
— Aditya Todmal (@AdityaTodmal) November 6, 2022
A comprehensive \U0001f9f5 :
Collaborated with @niki_poojary
10 most Powerful Intraday Setups with Screeners: \U0001f9f5
— Nikita Poojary (@niki_poojary) November 8, 2022
Collaborated with @AdityaTodmal
\U0001d5e0\U0001d602\U0001d5f9\U0001d601\U0001d5f6\U0001d5fd\U0001d5f9\U0001d5f2 \U0001d600\U0001d5f2\U0001d5f0\U0001d601\U0001d5fc\U0001d5ff \U0001d604\U0001d5ee\U0001d601\U0001d5f0\U0001d5f5\U0001d5f9\U0001d5f6\U0001d600\U0001d601 \U0001d5fc\U0001d5fb \U0001d5e7\U0001d5ff\U0001d5ee\U0001d5f1\U0001d5f6\U0001d5fb\U0001d5f4\U0001d603\U0001d5f6\U0001d5f2\U0001d604 \U0001d602\U0001d600\U0001d5f6\U0001d5fb\U0001d5f4 \U0001d601\U0001d5f5\U0001d5f2 \U0001d5d9\U0001d5e5\U0001d5d8\U0001d5d8 \U0001d603\U0001d5f2\U0001d5ff\U0001d600\U0001d5f6\U0001d5fc\U0001d5fb!
— Sarosij Ghosh (@sarosijghosh) September 18, 2021
A THREAD \U0001f9f5
Please Like and Re-Tweet. It took a lot of effort to put this together. #StockMarket #TradingView #trading #watchlist #Nifty500 #stockstowatch
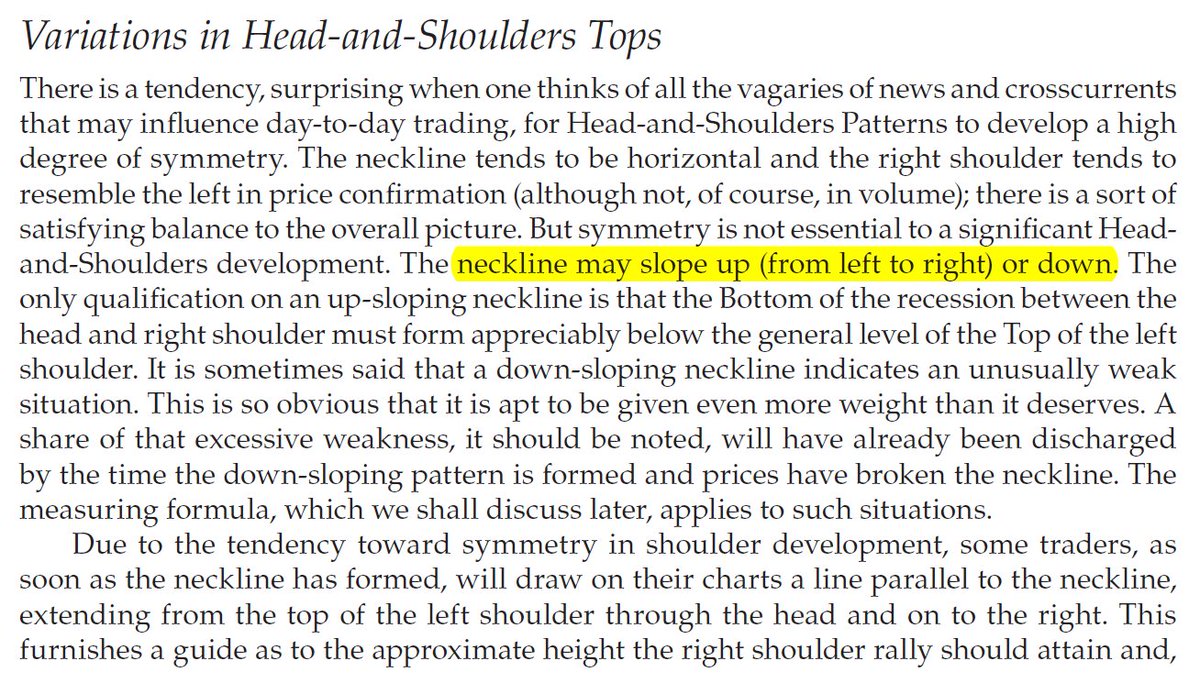
Sir Edwards & Magee discussed sloping necklines in H&S in their classical work. I am considering this breakdown by Affle as an H&S top breakdown with a target open of 770.
— The_Chartist \U0001f4c8 (@charts_zone) May 25, 2022
The target also coincides with support at the exact same level. pic.twitter.com/n84kSgkg4q