Authors The_Chartist 📈

Fresh case - RUPA https://t.co/nqq5nI1wLU
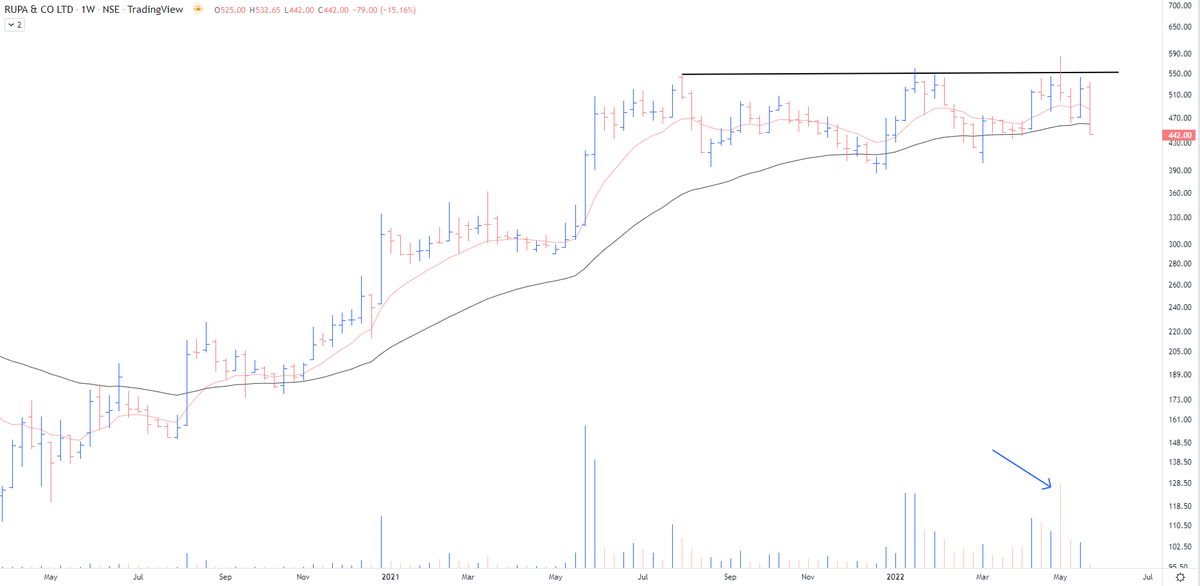
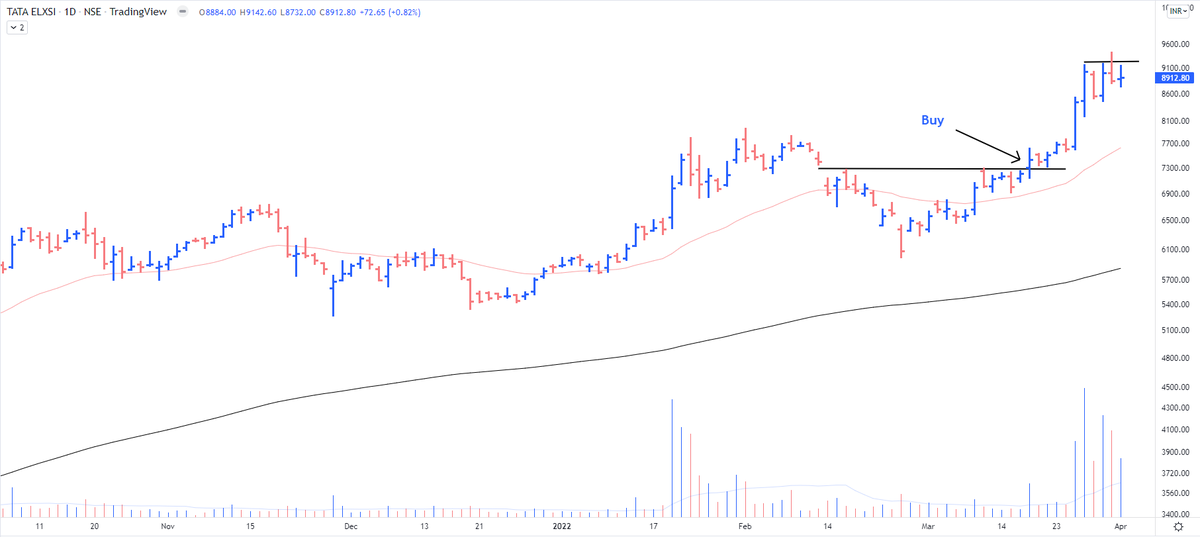
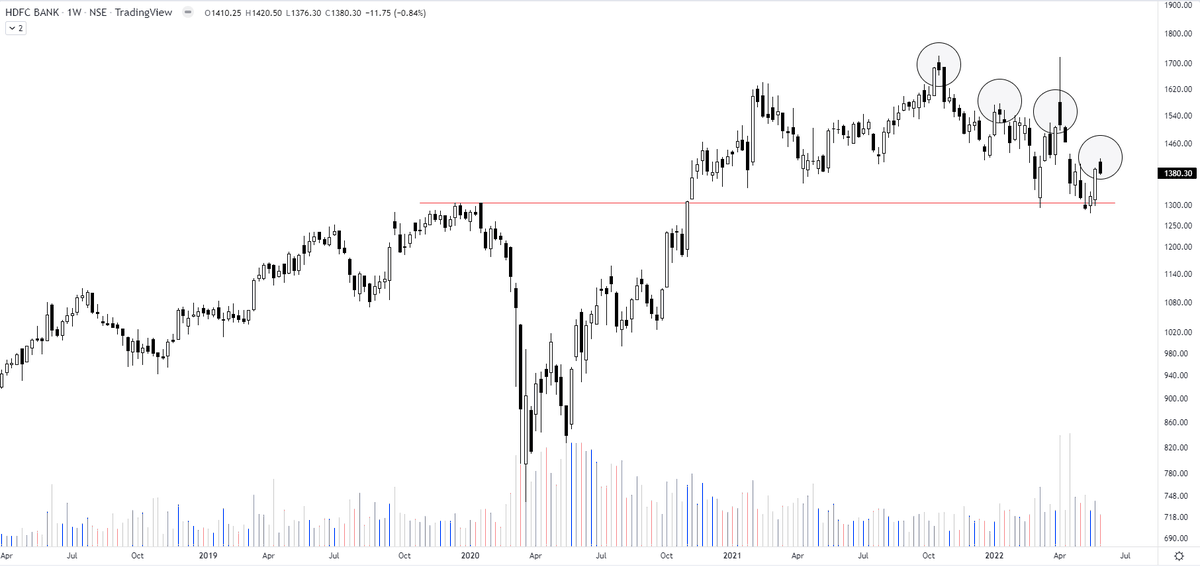
Respect your stop losses in the stocks that have gone down today with heavy volumes even on a strong day.
— The_Chartist \U0001f4c8 (@charts_zone) March 17, 2022
VTL pic.twitter.com/3pJ9XngCDL
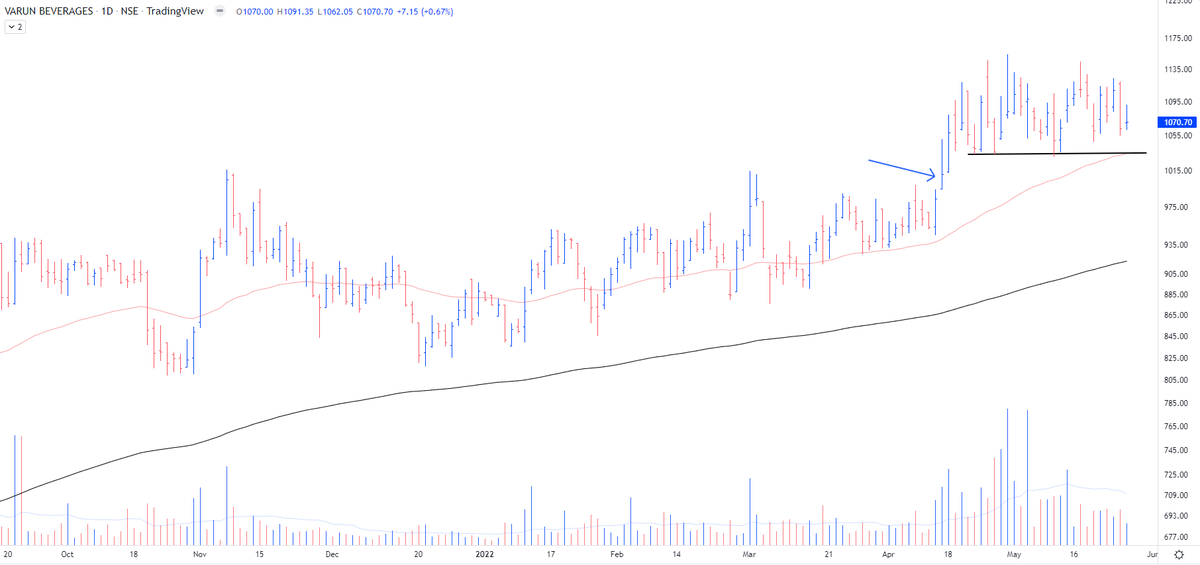

~ capitulation move
~ no further selling left
~ a major TL validated on a weekly scale
~ highest R:R ratio
With such capitulation & tight SL = capital put in was 30%
Risk = 50, Reward = 350
Jubilant Food https://t.co/M1vLYEsngf
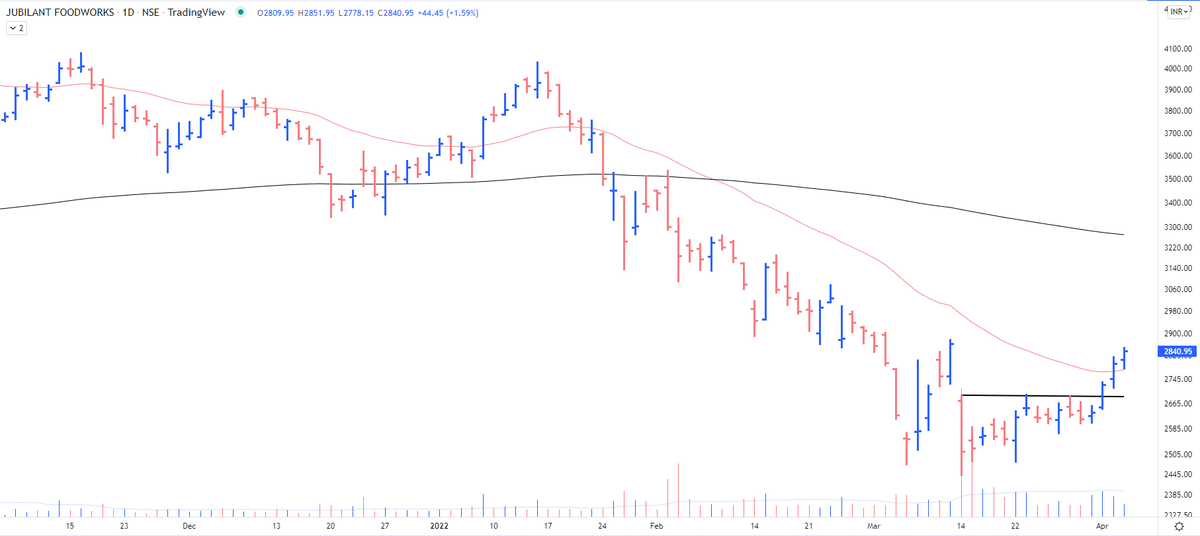
The selling climax is accompanied by volume bars of such magnitude that I highlighted in the chart. In almost all cases, they signify that even the last bull has thrown in the towel & there is no further selling left. Will observe in this case.
— The_Chartist \U0001f4c8 (@charts_zone) March 15, 2022
Jubilant Food pic.twitter.com/j7bGSdhkRW
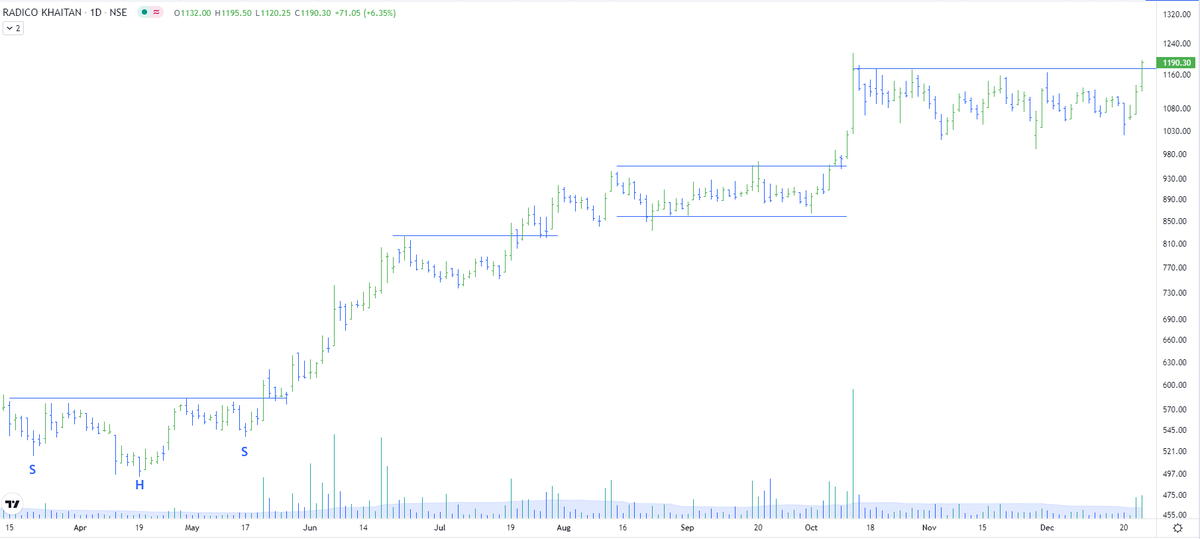
AWL - look at the ranges of contraction on the chart https://t.co/2XMhqZQu8X
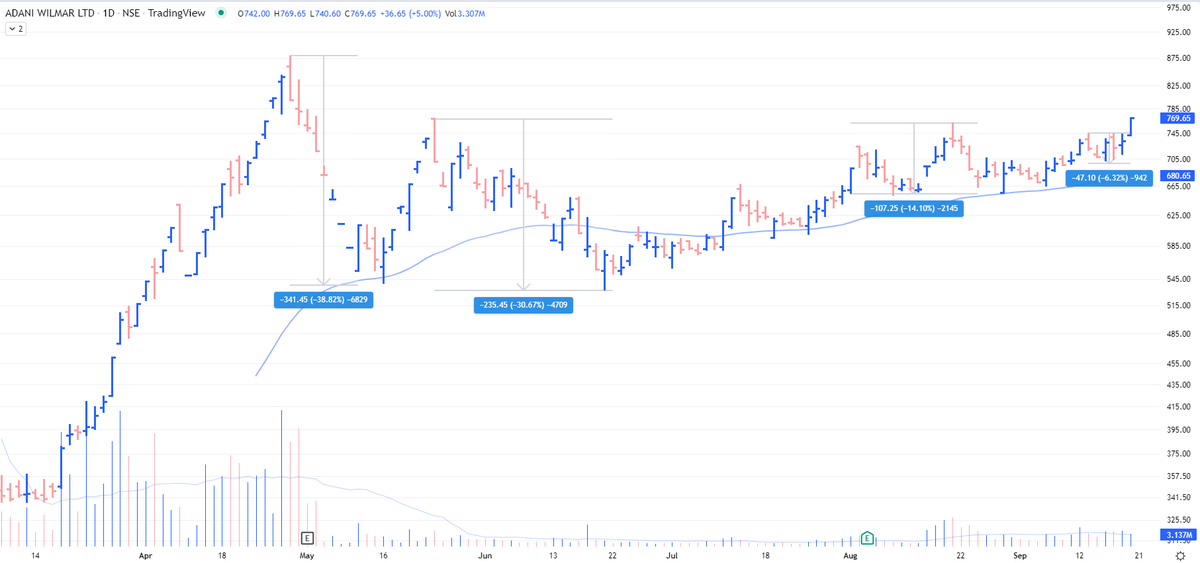
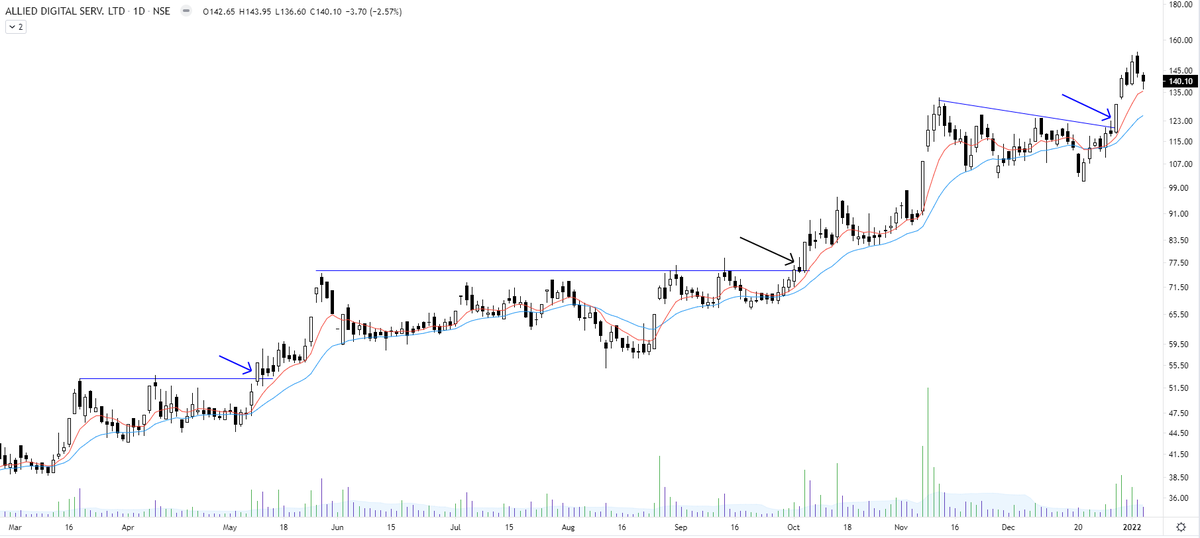
Borosil Renewables - Patterns like these must be looked at carefully and must be kept on the radar. Herein price is contracting which generally signifies shifting of hands (from weak to strong). If you go wrong, the risk is limited in these. pic.twitter.com/iqyoeslZjy
— The_Chartist \U0001f4c8 (@charts_zone) July 12, 2021

So far doing good. 2000 is the level I would be looking for. https://t.co/j1kiKRSx0y
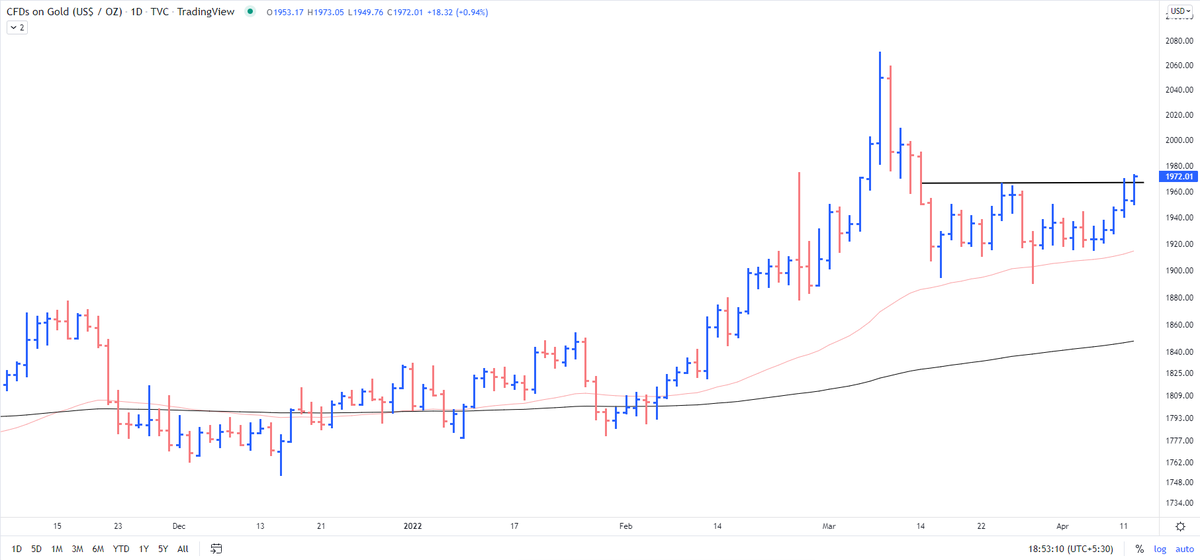
GOLD - 1 9 2 7 from 1 8 5 0
— The_Chartist \U0001f4c8 (@charts_zone) February 24, 2022
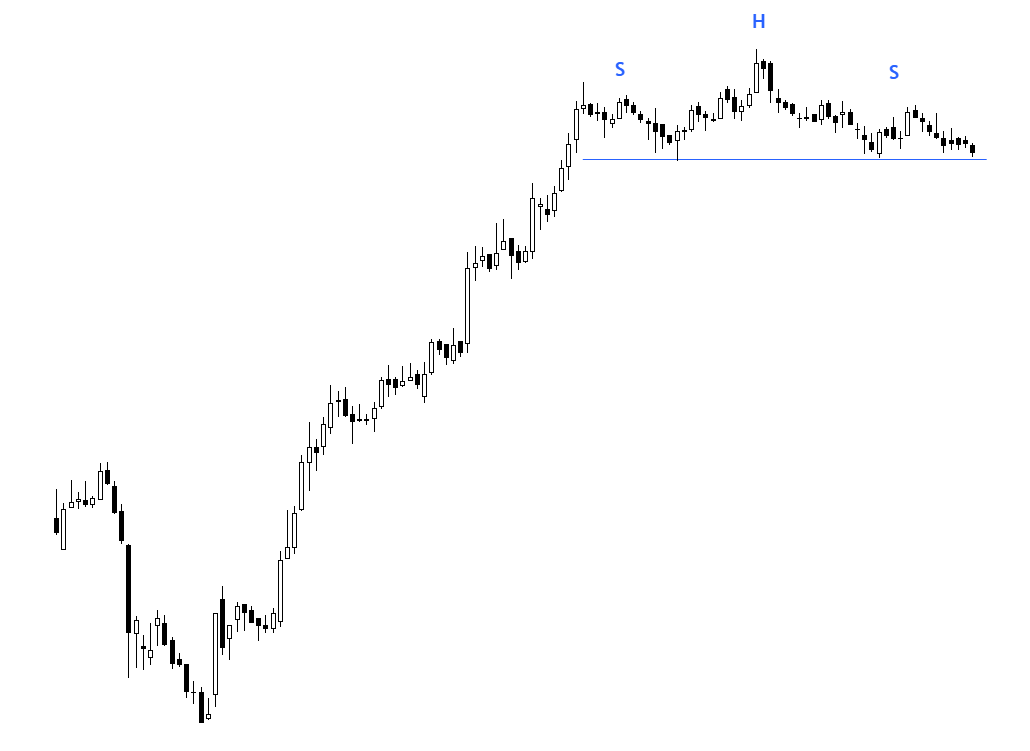
No indicators, nothing. Understand the language of the price. https://t.co/l6pEGD7r6D pic.twitter.com/JWZjlTLSBF
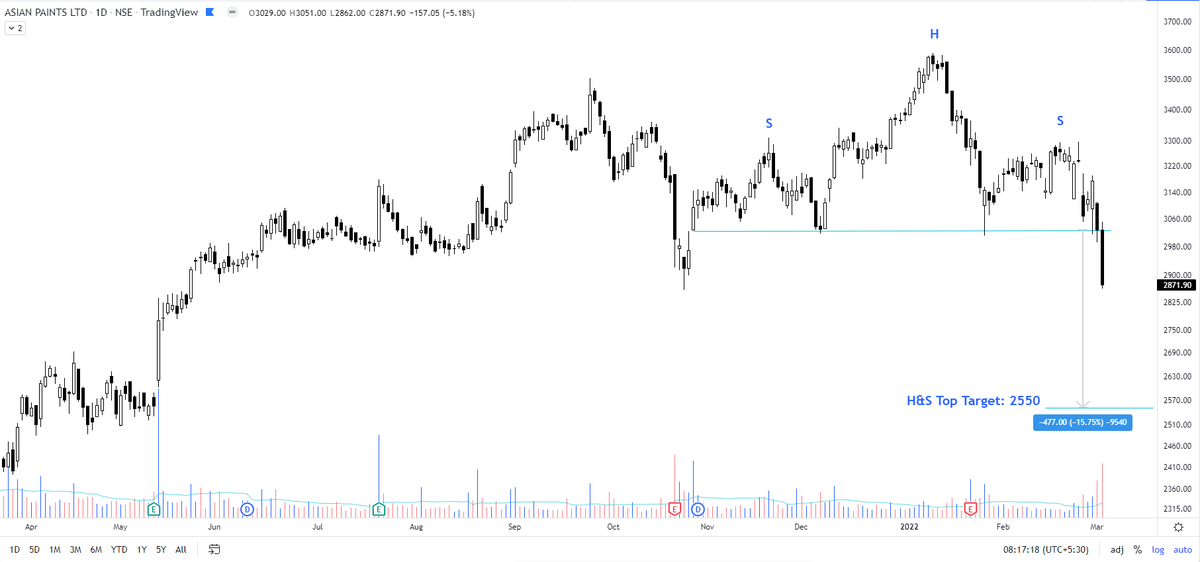
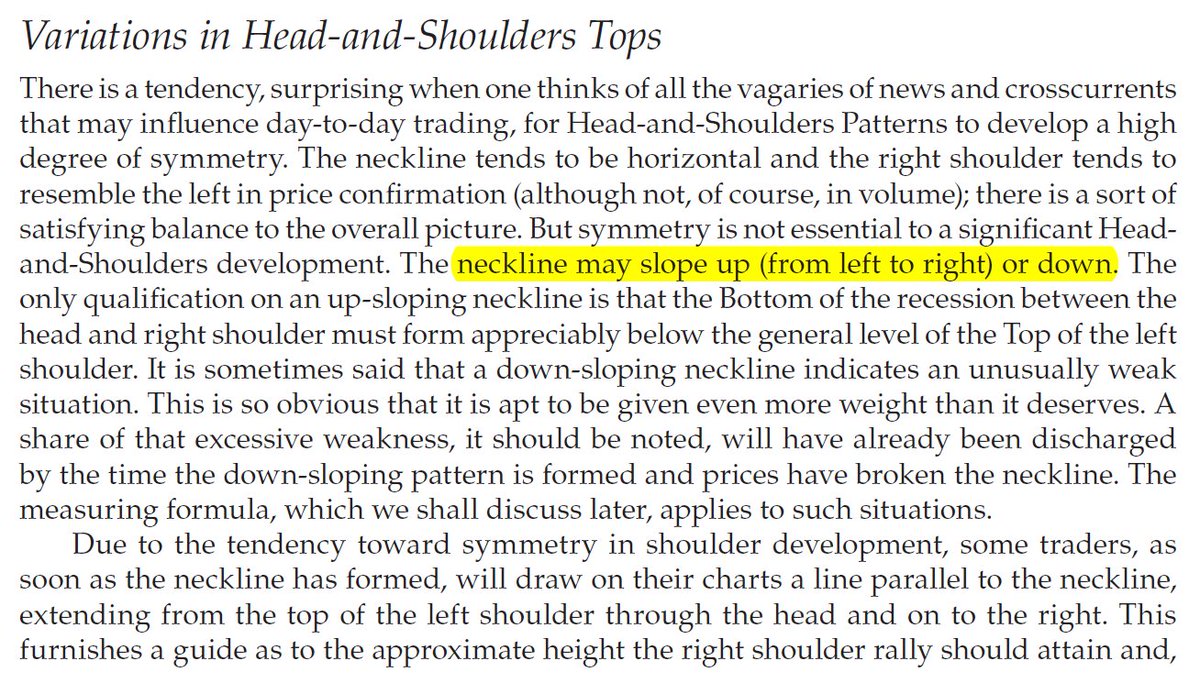
Sir Edwards & Magee discussed sloping necklines in H&S in their classical work. I am considering this breakdown by Affle as an H&S top breakdown with a target open of 770.
— The_Chartist \U0001f4c8 (@charts_zone) May 25, 2022
The target also coincides with support at the exact same level. pic.twitter.com/n84kSgkg4q
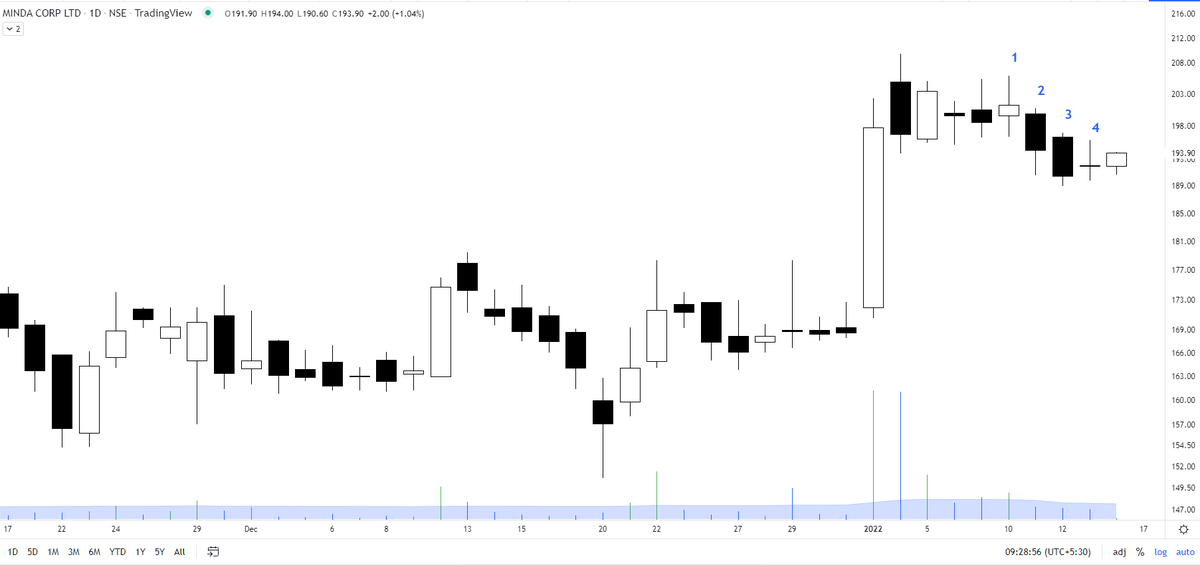
Russell 2000
It is better if you spend considerable time learning these concepts. https://t.co/caBHOO4Owa
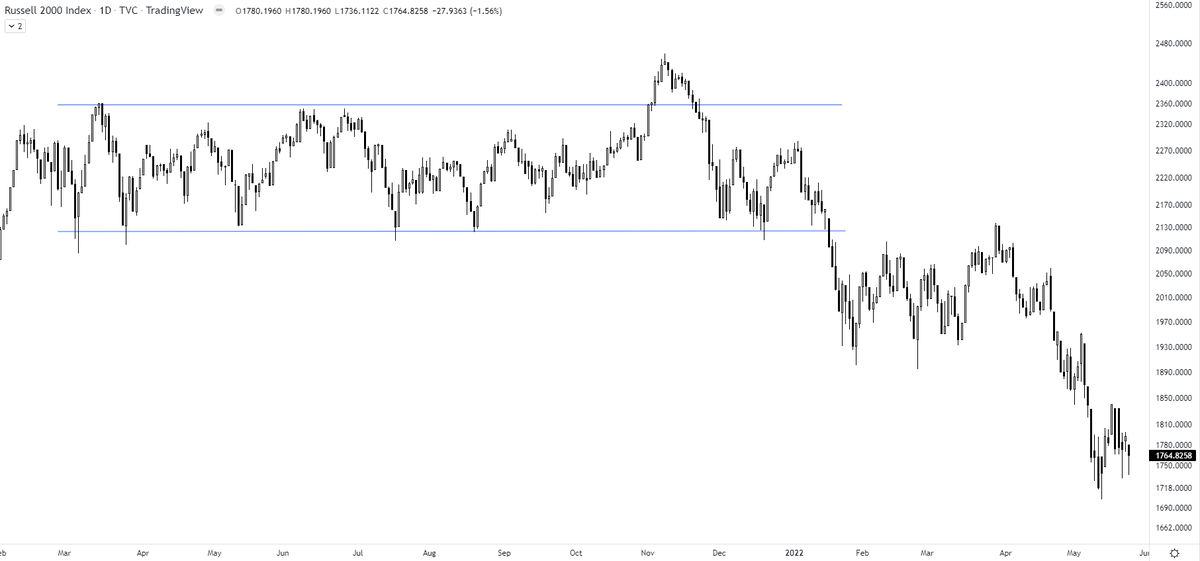
TRAPS? In a false breakout, the price breaks out of the range & comes back within the range. A trap is one step ahead, price not only comes back within the range but breaks down in the opposite direction. It traps the initial longs who didn't close their positions
— The_Chartist \U0001f4c8 (@charts_zone) January 22, 2022
Russell 2000 pic.twitter.com/txzjdnStzc