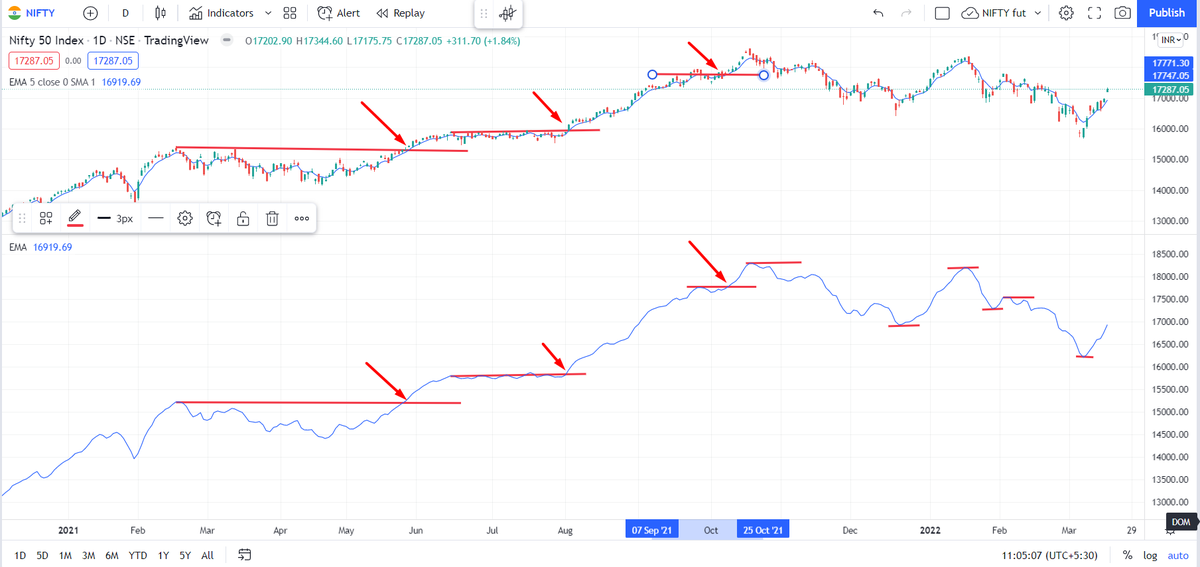
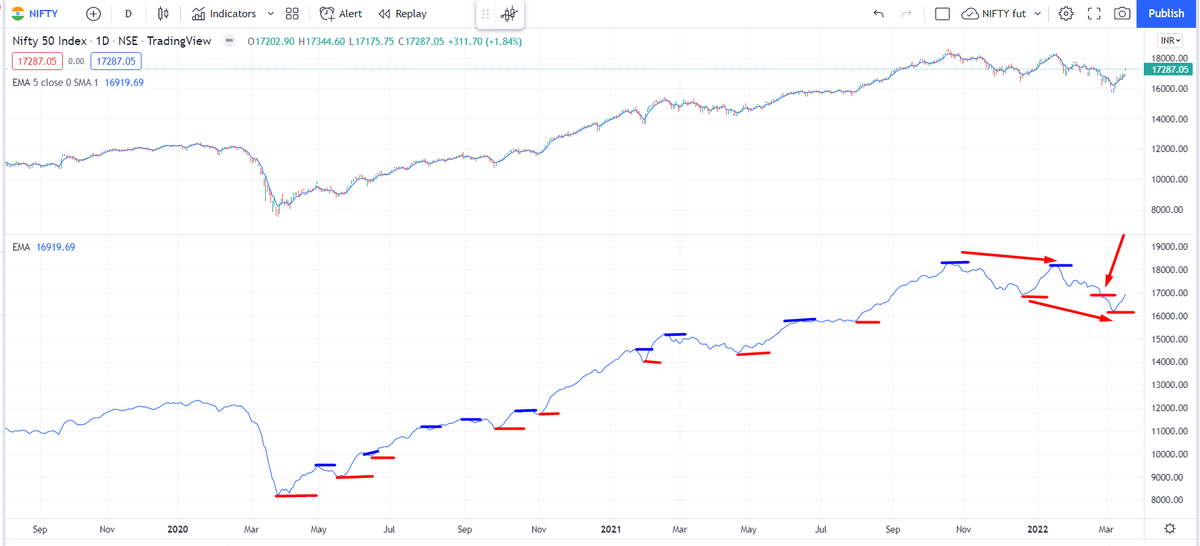
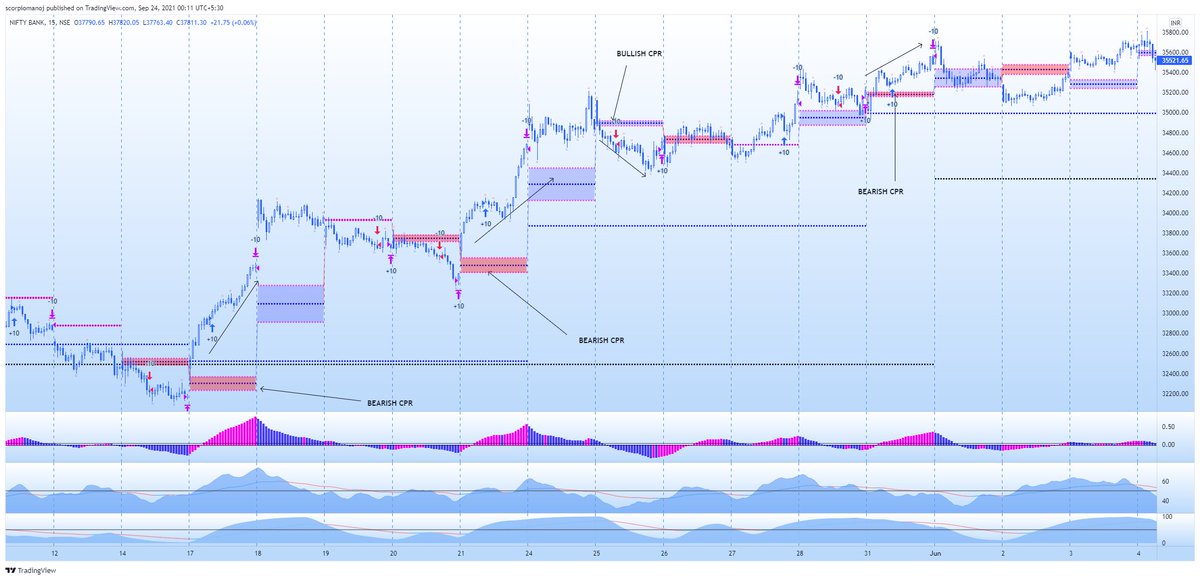
The most important question now on the mind of all analysts and traders. Is this a bear market rally or is this the start of a bull move. Retweeting this as I will need a few tweets to explain my view
Is Nifty bullish, or bearish?
— AP (@ap_pune) March 19, 2022
Replies MUST be ONLY with charts, not just 'views', no Russia Ukraine, crude, gold etc.
Can be levels....abv/below
Just technicals....maybe with trend lines, indicators or any other study (EW, harmonics etc)
Charts can be daily, weekly or monthly.
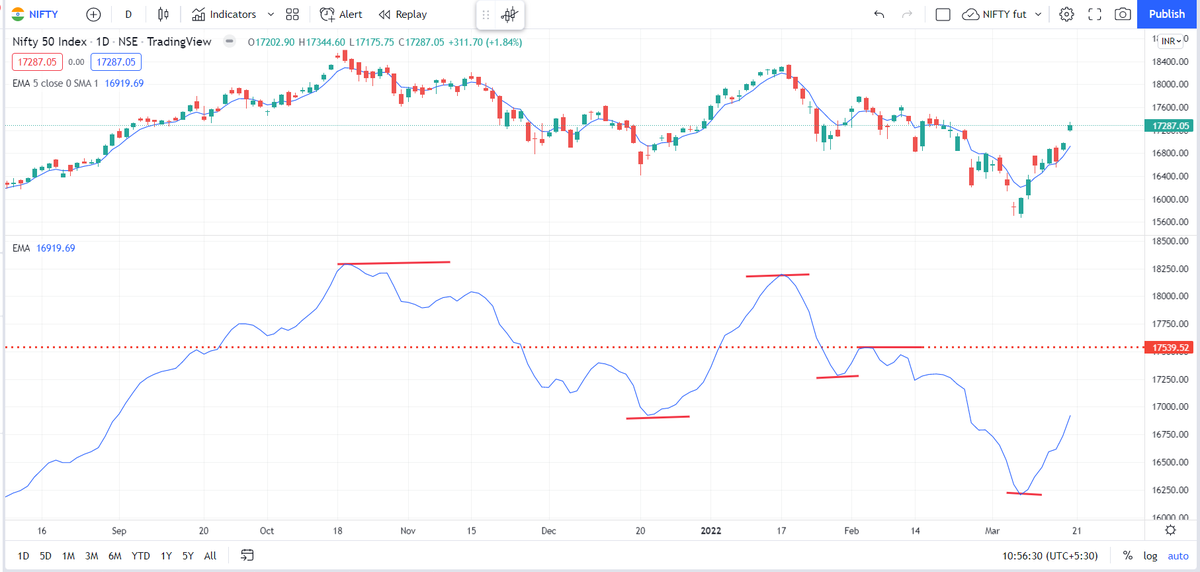
That is not the case now, which holds me back from calling this a clean bull market

More from Subhadip Nandy
Time I retweeted this 😃
IV - A thread
— Subhadip Nandy (@SubhadipNandy16) September 20, 2018
In financial mathematics, implied volatility of an option contract is
that value of the volatility of the underlying instrument which, when
input in an option pricing model ) will return a theoretical value equal to the current market price of the option (1/n)


Study this thread and then check the VIX charts and Nifty charts from 1st Oct 2018. There is a reason I am retweeting this now :)
1. IV > HV
— Subhadip Nandy (@SubhadipNandy16) October 5, 2018
2. High IVR
3. Sell strangles 2SD away
This is the crux of all complicated option selling strategies . Nothing so simple can work across all market conditions .
More from Screeners


May please read the attached tweet once again for a key LEARNING
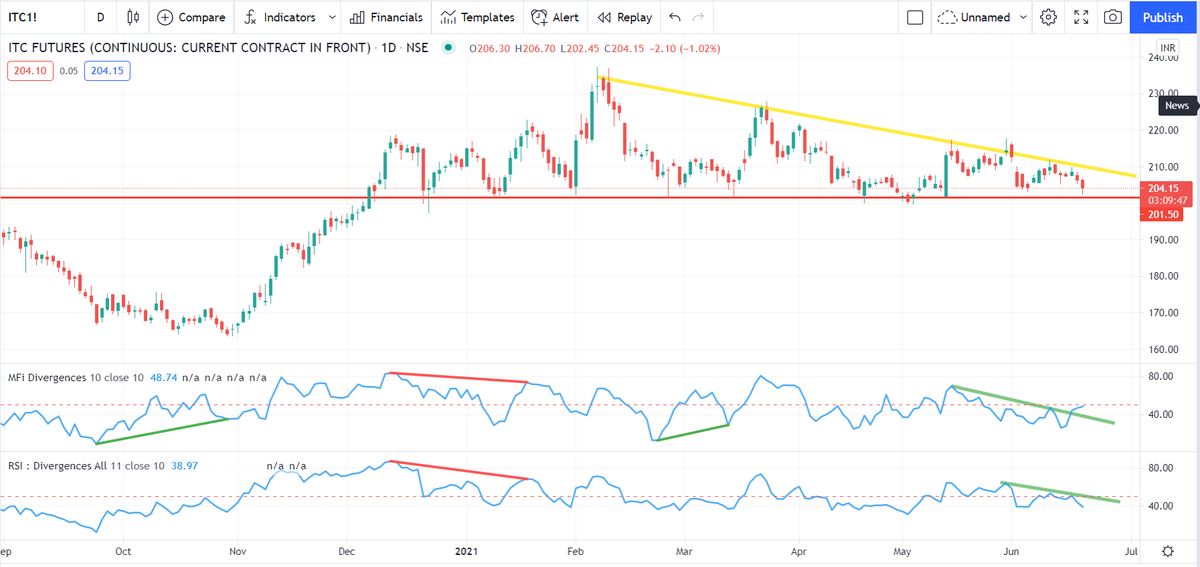
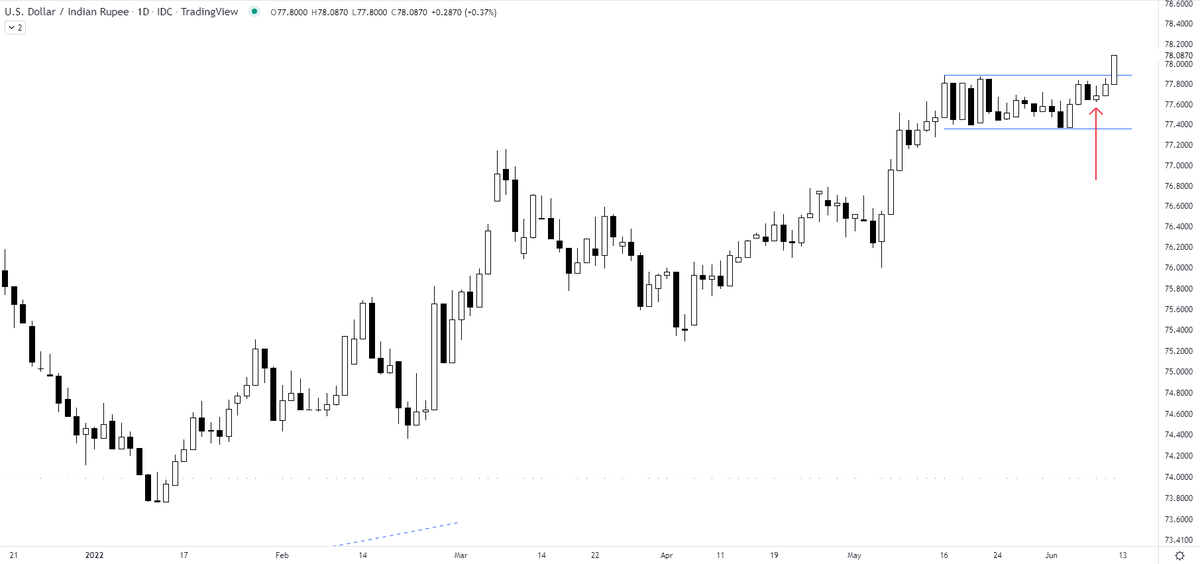
USDINR - a breakout that will not bode well for the equities
78+ https://t.co/AWqZxF5B1L
USDINR - a breakout that will not bode well for the equities
78+ https://t.co/AWqZxF5B1L
Can you anticipate a breakout? Yes
— The_Chartist \U0001f4c8 (@charts_zone) June 10, 2022
the attached tweet.
now the chart is for USDINR https://t.co/Vb2wKaCvTB pic.twitter.com/INo0GC4fGY