https://t.co/9ukwfjLDYT
DRIVE LINK FOR
Pdf made me
Open Folder: Educational Pdfs
Name : Complete Guide to Swing Trading
More than 15+ Pdfs shared
Retweet And Share
// End //
More from JayneshKasliwal


Chartink Screeners Complete Compilation
Sharing 9 Screeners🧵
1. Swing Trading Techno Funda https://t.co/sV6e8XSFRK
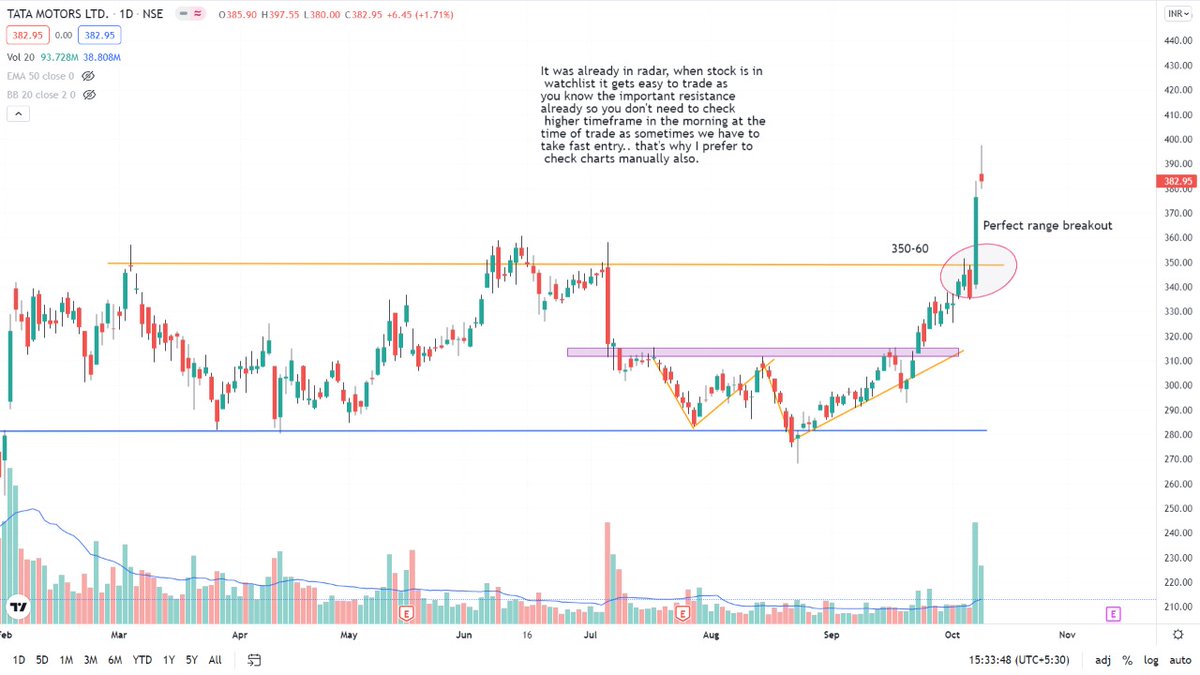
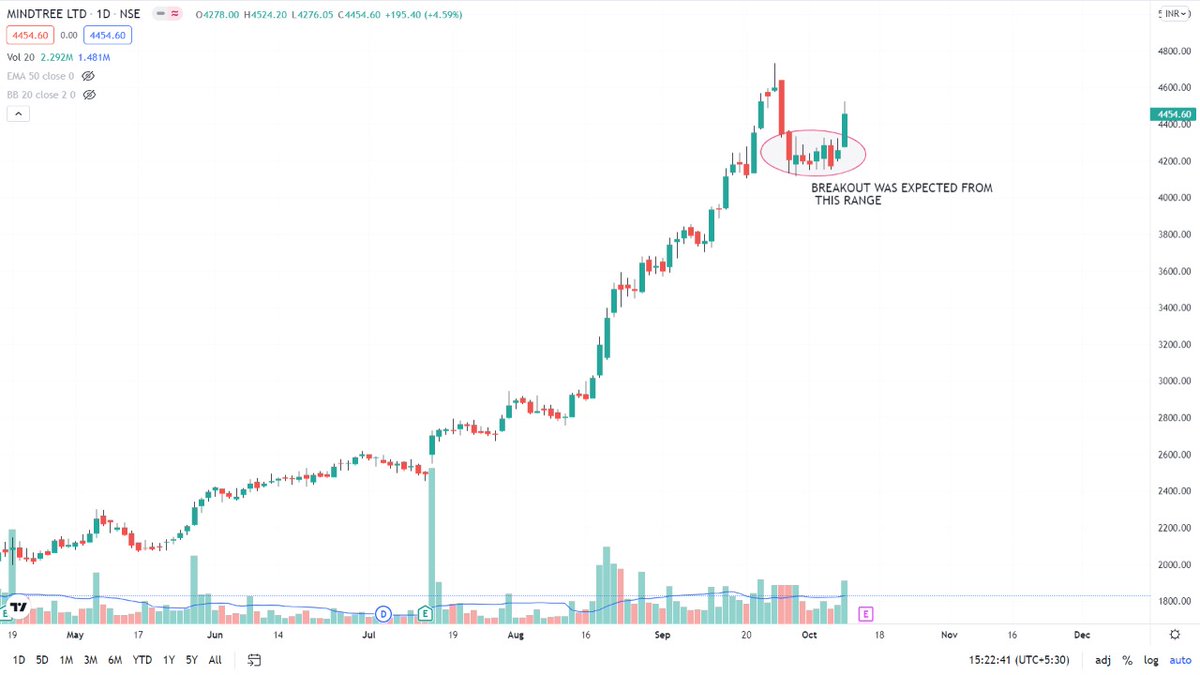
2.Range Breakout
https://t.co/SNKEpGHNtv
3. Stocks in Tight Range :
https://t.co/MqDFMEfj82
Telegram Link : https://t.co/b4N4oPjqm9
Retweet and Share !
4.Stock Closing up 3% Since 3 days
https://t.co/vLGG9k3YKz
5. Close above 21 ema
https://t.co/fMZkgLczxR
6. Days Fall and Reversal
7. 52 WEEK high Stocks.
https://t.co/H6Z6IGMRwS
8. Intraday Stocks :https://t.co/JoXYRcogj7
9. Darvas Box
Sharing 9 Screeners🧵
1. Swing Trading Techno Funda https://t.co/sV6e8XSFRK
2.Range Breakout
https://t.co/SNKEpGHNtv
3. Stocks in Tight Range :
https://t.co/MqDFMEfj82
Telegram Link : https://t.co/b4N4oPjqm9
Retweet and Share !
4.Stock Closing up 3% Since 3 days
https://t.co/vLGG9k3YKz
5. Close above 21 ema
https://t.co/fMZkgLczxR
6. Days Fall and Reversal
7. 52 WEEK high Stocks.
https://t.co/H6Z6IGMRwS
8. Intraday Stocks :https://t.co/JoXYRcogj7
9. Darvas Box


𝗛𝗼𝘄 𝘁𝗼 𝗰𝗿𝗲𝗮𝘁𝗲 𝘆𝗼𝘂𝗿 𝗼𝘄𝗻 𝗖𝗵𝗮𝗿𝘁𝗶𝗻𝗸 𝗦𝗰𝗿𝗲𝗲𝗻𝗲𝗿
🧵 Thread 🧵
[1/15]
𝗖𝗵𝗮𝗿𝘁𝗶𝗻𝗸 𝗦𝗰𝗿𝗲𝗲𝗻𝗲𝗿 is a Stock screening tool that is useful to screen stocks based on Technical & Fundamentals.
🔸 It scans stocks by using technical indicators like RSI, MACD, divergences, etc.
🔸 It also uses fundamental tools like Book Value, EPS,PE etc
[2/15]
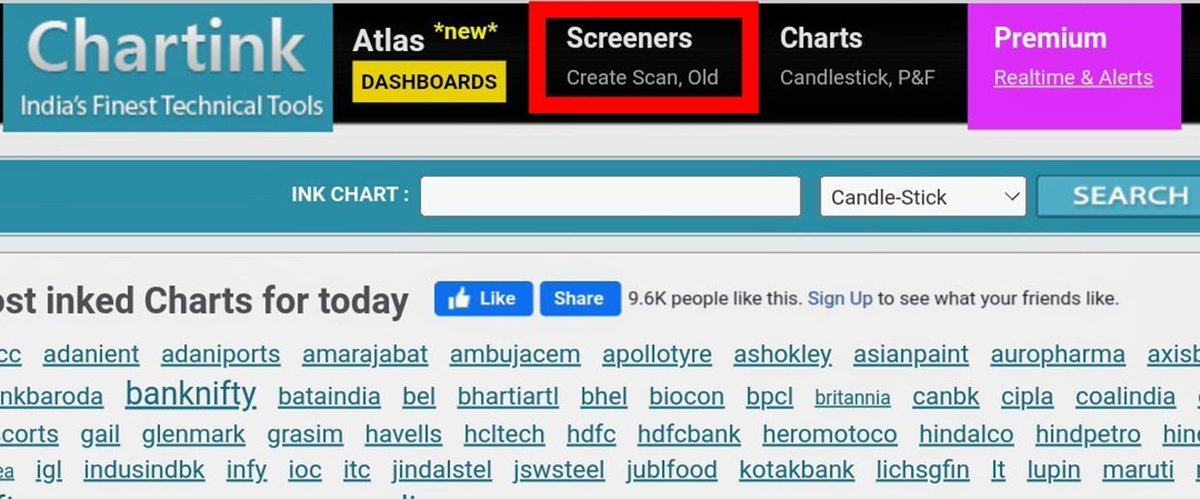
How To Create A Scan ?
Go to https://t.co/nQ7t44bt9T & click on 𝘊𝘳𝘦𝘢𝘵𝘦 𝘚𝘤𝘢𝘯 under 𝘚𝘤𝘳𝘦𝘦𝘯𝘦𝘳𝘴.
[3/15]
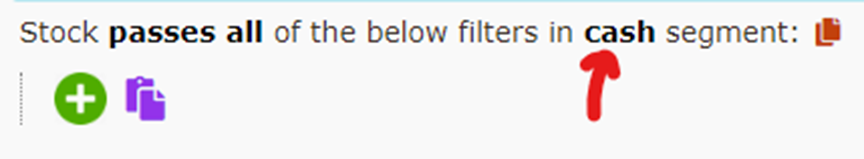
𝗙𝗶𝗿𝘀𝘁 𝗦𝘁𝗲𝗽 𝗧𝗼 𝗙𝗶𝗹𝘁𝗲𝗿 𝗦𝘁𝗼𝗰𝗸𝘀
We can select segments of stocks of our choice, e.g. cash or futures stocks, Nifty 100 etc.
Click on green ‘+’ icon to add conditions.
[4/15]
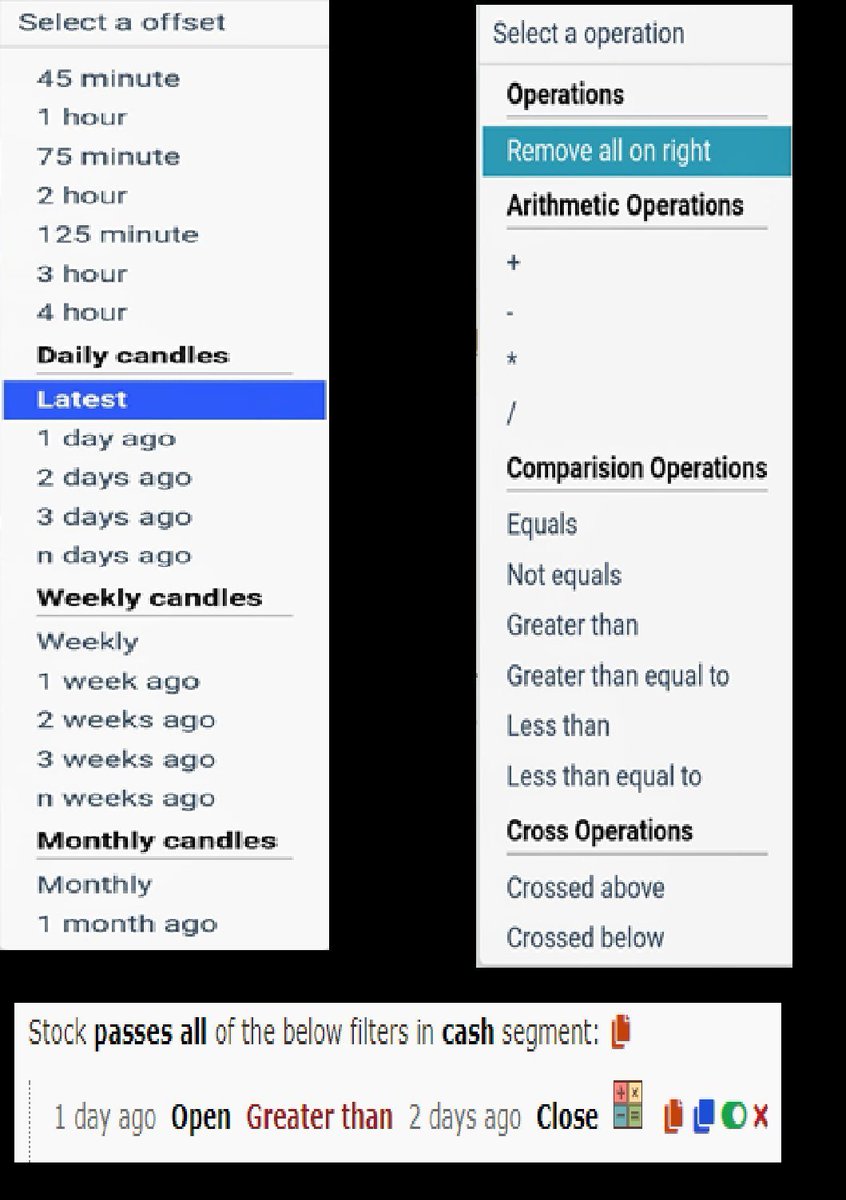
𝗖𝗮𝗻𝗱𝗹𝗲 𝗧𝗶𝗺𝗲𝗳𝗿𝗮𝗺𝗲𝘀 & 𝗖𝗼𝗺𝗽𝗮𝗿𝗶𝘀𝗼𝗻 𝗢𝗽𝗲𝗿𝗮𝘁𝗼𝗿𝘀
🔸 We can select any timeframe of candles in Chartink, from minutes to years.
🔸 And compare two candles using comparison operators like 𝘌𝘲𝘶𝘢𝘭 𝘵𝘰 or 𝘎𝘳𝘦𝘢𝘵𝘦𝘳 𝘛𝘩𝘢𝘯 , crossovers etc
[5/15]
🧵 Thread 🧵
[1/15]
𝗖𝗵𝗮𝗿𝘁𝗶𝗻𝗸 𝗦𝗰𝗿𝗲𝗲𝗻𝗲𝗿 is a Stock screening tool that is useful to screen stocks based on Technical & Fundamentals.
🔸 It scans stocks by using technical indicators like RSI, MACD, divergences, etc.
🔸 It also uses fundamental tools like Book Value, EPS,PE etc
[2/15]
How To Create A Scan ?
Go to https://t.co/nQ7t44bt9T & click on 𝘊𝘳𝘦𝘢𝘵𝘦 𝘚𝘤𝘢𝘯 under 𝘚𝘤𝘳𝘦𝘦𝘯𝘦𝘳𝘴.
[3/15]
𝗙𝗶𝗿𝘀𝘁 𝗦𝘁𝗲𝗽 𝗧𝗼 𝗙𝗶𝗹𝘁𝗲𝗿 𝗦𝘁𝗼𝗰𝗸𝘀
We can select segments of stocks of our choice, e.g. cash or futures stocks, Nifty 100 etc.
Click on green ‘+’ icon to add conditions.
[4/15]
𝗖𝗮𝗻𝗱𝗹𝗲 𝗧𝗶𝗺𝗲𝗳𝗿𝗮𝗺𝗲𝘀 & 𝗖𝗼𝗺𝗽𝗮𝗿𝗶𝘀𝗼𝗻 𝗢𝗽𝗲𝗿𝗮𝘁𝗼𝗿𝘀
🔸 We can select any timeframe of candles in Chartink, from minutes to years.
🔸 And compare two candles using comparison operators like 𝘌𝘲𝘶𝘢𝘭 𝘵𝘰 or 𝘎𝘳𝘦𝘢𝘵𝘦𝘳 𝘛𝘩𝘢𝘯 , crossovers etc
[5/15]
More from Screeners


H&S tops with ascending/descending necklines https://t.co/cmRRHp5rlh
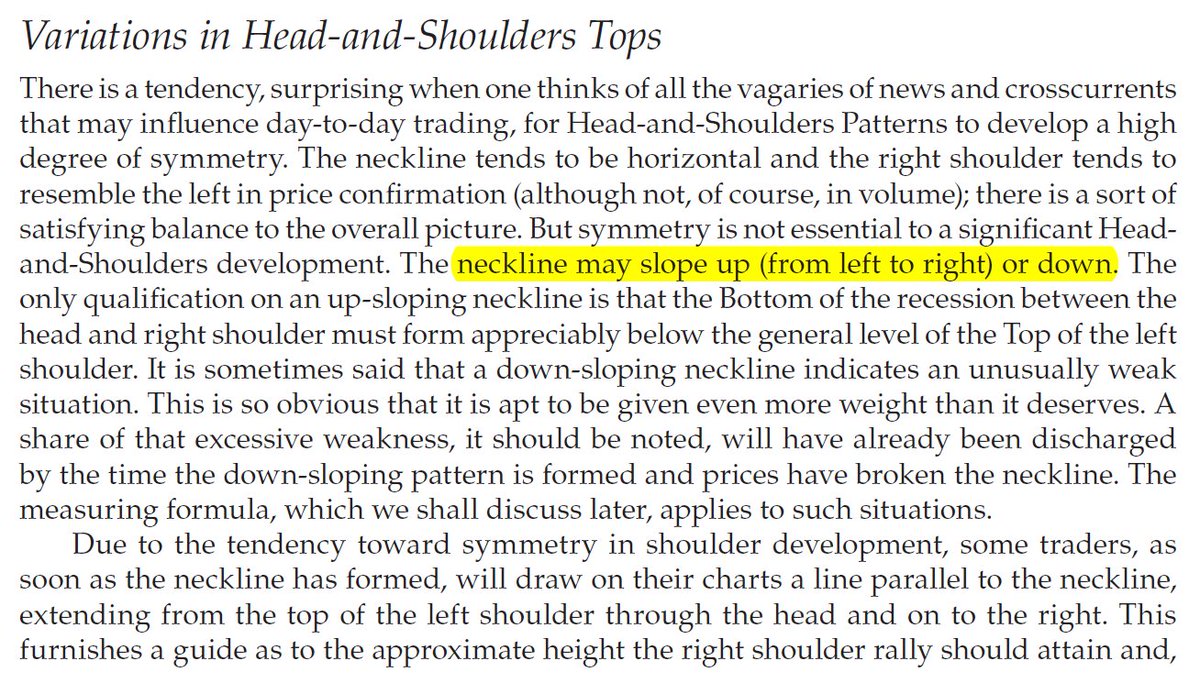
Sir Edwards & Magee discussed sloping necklines in H&S in their classical work. I am considering this breakdown by Affle as an H&S top breakdown with a target open of 770.
— The_Chartist \U0001f4c8 (@charts_zone) May 25, 2022
The target also coincides with support at the exact same level. pic.twitter.com/n84kSgkg4q