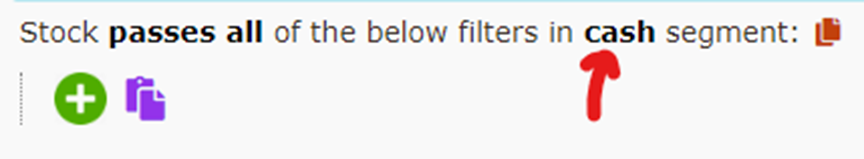
🔸 It scans stocks by using technical indicators like RSI, MACD, divergences, etc.
🔸 It also uses fundamental tools like Book Value, EPS,PE etc
[2/15]


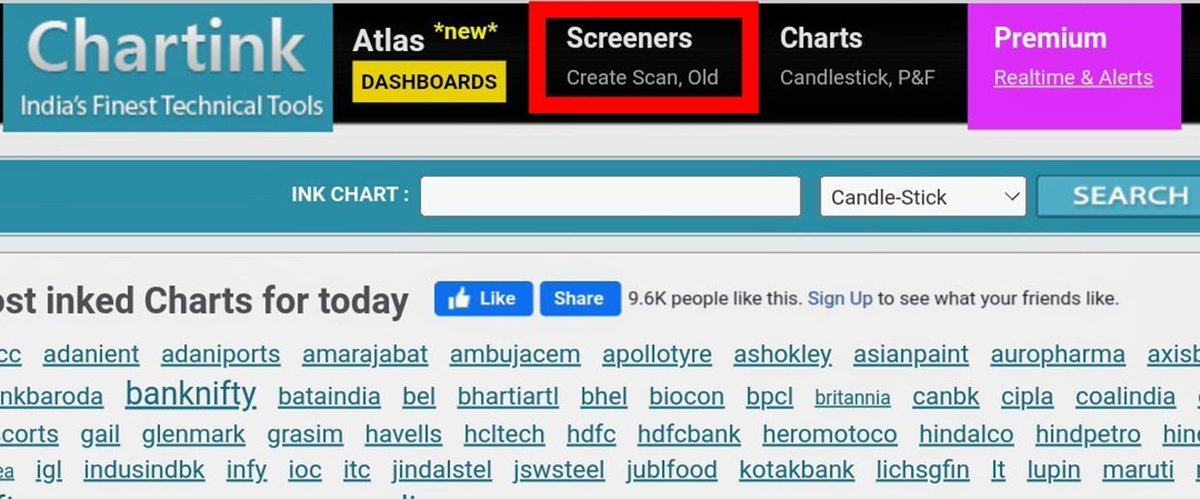
Chartink Screeners Complete Compilation
— JayneshKasliwal (@JayneshKasliwal) March 25, 2022
Sharing 9 Screeners\U0001f9f5
1. Swing Trading Techno Funda https://t.co/sV6e8XSFRK
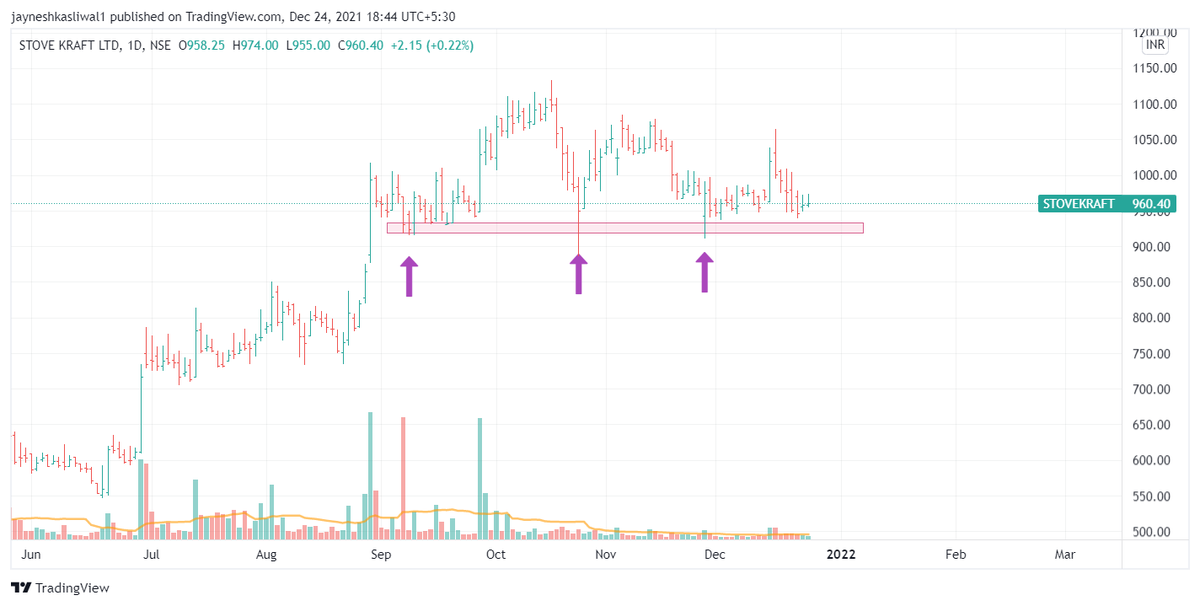
2.Range Breakout https://t.co/SNKEpGHNtv
3. Stocks in Tight Range :https://t.co/MqDFMEfj82
Telegram Link : https://t.co/b4N4oPjqm9
Retweet and Share !

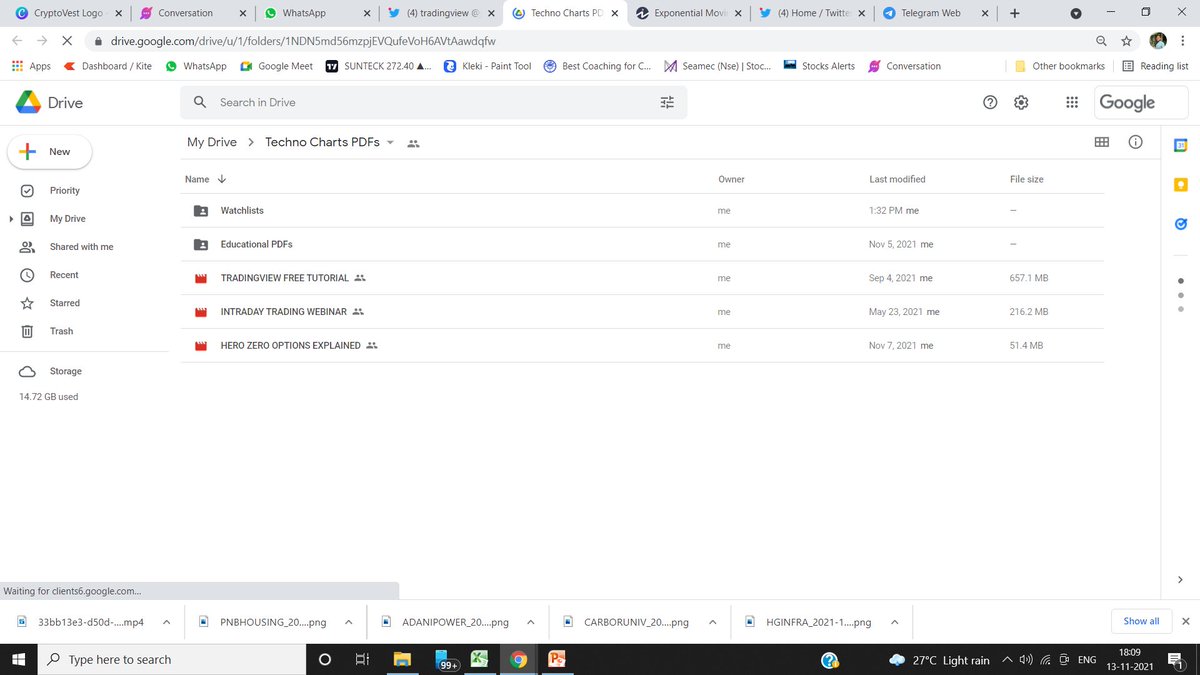
Drive Link for
— JayneshKasliwal (@JayneshKasliwal) November 5, 2021
Custom Made Pdfs on
1. Trading Strategies
2. Stock Selection
3. Tradingview Free Tutorial
4. Psychology https://t.co/9ukwfjLDYT
Retweet Share !@kuttrapali26 @MarketScientist @AmitabhJha3