I use 4 scanners:
1) Volatility, Volume & daily range compression scanner
2) Punch-Drunk-Love
3) GE Ratio - to track fundamentally strong stocks
4) Recently created one to track Power Play setups.
I get around 150-200 stocks daily & choose the ones with the most potential.
Sir, How do u find a set up - Do you track chart of each stock daily ? Or do u have filters , that lead you to a number of stocks , after which you scan them.
— AKASH GUPTA (@lockdownmurti) August 25, 2021
More from Ravi Sharma
I read about it in 'Trading for a Loving written by Dr. Alexander Elder.
I highly recommend this book to all the beginners in stock market.
* Trading for a Living
I highly recommend this book to all the beginners in stock market.
Sir, if not wrong you taught MACD -H in your elearn webinar also? From where you have learned it?
— Prakhar (@Indiantrader101) August 23, 2021
* Trading for a Living
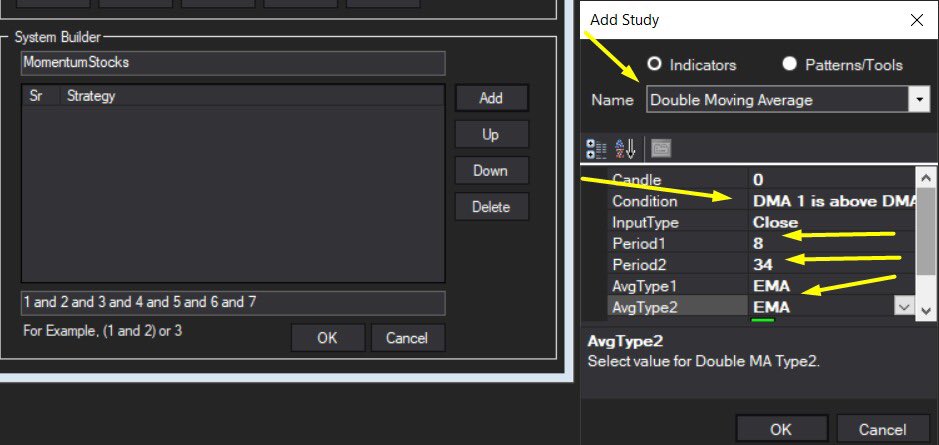
Instead of Simple Moving Averages, I use Weighted Moving Averages. I use the following signals to identify Stage 2-
1) 50 WMA > 100 WMA > 150 WMA > 200 WMA
2) Price is within 25% range of its 52-Week High and above 30% or more from its 52-Week Low.
1) 50 WMA > 100 WMA > 150 WMA > 200 WMA
2) Price is within 25% range of its 52-Week High and above 30% or more from its 52-Week Low.
Just one question , how do u differentiate stage 2 from 1 , apart from volume , what else do u look ?
— Priyanshu (@Priyans48107837) August 6, 2021