Instead of Simple Moving Averages, I use Weighted Moving Averages. I use the following signals to identify Stage 2-
1) 50 WMA > 100 WMA > 150 WMA > 200 WMA
2) Price is within 25% range of its 52-Week High and above 30% or more from its 52-Week Low.
Just one question , how do u differentiate stage 2 from 1 , apart from volume , what else do u look ?
— Priyanshu (@Priyans48107837) August 6, 2021
More from Ravi Sharma
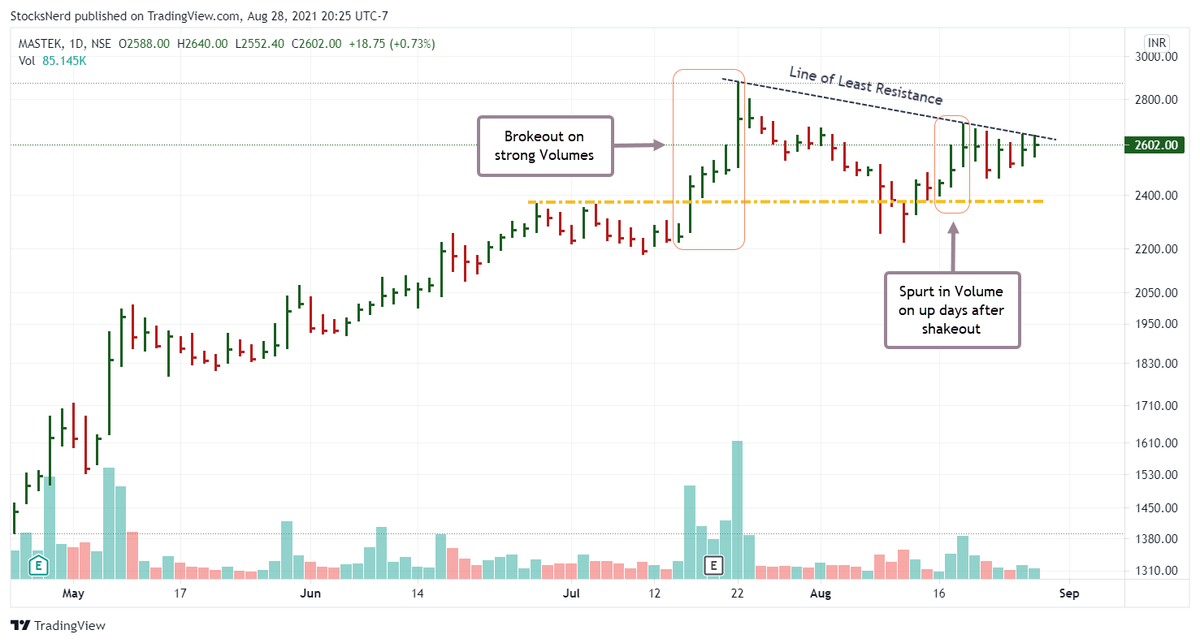
While buying breakouts, your odds will improve a lot when you prefer the following:
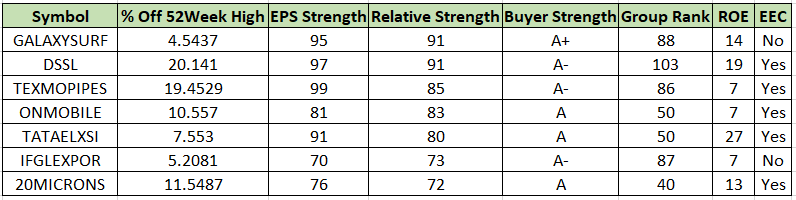
1. Strong Relative Strength.
2. Tight price range on low Volume and a pattern which is easy on eyes. https://t.co/CprKpAfgtj
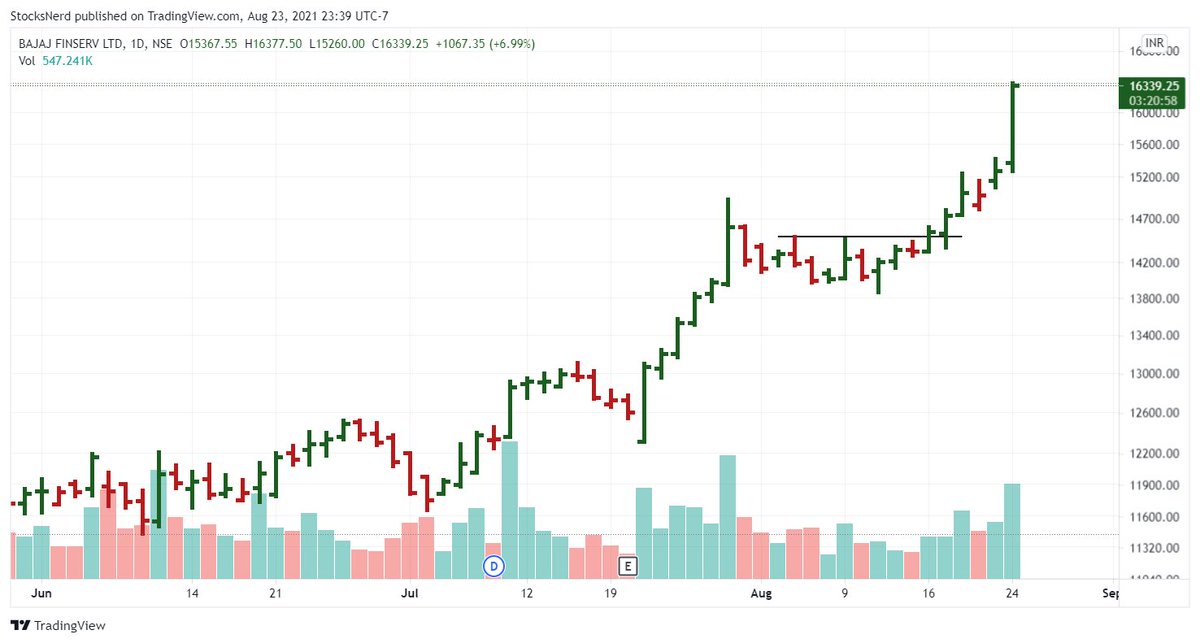
#BAJAJFINSV
— Ravi Sharma (@StocksNerd) August 14, 2021
Setting up in a tight base. Volume has been drying up.
Waiting for the breakout. pic.twitter.com/KWoGZAwkLO
I have made some minor tweakings to this timing model since this tweet but it still will give you an idea and primer 👇
Trading 101 with SmallCap Index
— Ravi Sharma (@StocksNerd) August 20, 2019
1. Swing trades when bullish divergence in MACD-H forms
2. Breakout trades if Index closes above 22-Day high
3. Pullback/Pocket Pivot trades if Index consolidates constructively while13-EMA>22-EMA
4. Sell, go cash if Index breaches 10-Day low, NQA pic.twitter.com/u8VjXrU0Re
1) Volatility, Volume & daily range compression scanner
2) Punch-Drunk-Love
3) GE Ratio - to track fundamentally strong stocks
4) Recently created one to track Power Play setups.
I get around 150-200 stocks daily & choose the ones with the most potential.
Sir, How do u find a set up - Do you track chart of each stock daily ? Or do u have filters , that lead you to a number of stocks , after which you scan them.
— AKASH GUPTA (@lockdownmurti) August 25, 2021
More from Screeners

Here I will share what I believe are essentials for anybody who is interested in stock markets and the resources to learn them, its from my experience and by no means exhaustive..
First the very basic : The Dow theory, Everybody must have basic understanding of it and must learn to observe High Highs, Higher Lows, Lower Highs and Lowers lows on charts and their
Even those who are more inclined towards fundamental side can also benefit from Dow theory, as it can hint start & end of Bull/Bear runs thereby indication entry and exits.

Next basic is Wyckoff's Theory. It tells how accumulation and distribution happens with regularity and how the market actually
Dow theory is old but
Old is Gold....
— Professor (@DillikiBiili) January 23, 2020
this Bharti Airtel chart is a true copy of the Wyckoff Pattern propounded in 1931....... pic.twitter.com/tQ1PNebq7d

1) Volatility, Volume & daily range compression scanner
2) Punch-Drunk-Love
3) GE Ratio - to track fundamentally strong stocks
4) Recently created one to track Power Play setups.
I get around 150-200 stocks daily & choose the ones with the most potential.
Sir, How do u find a set up - Do you track chart of each stock daily ? Or do u have filters , that lead you to a number of stocks , after which you scan them.
— AKASH GUPTA (@lockdownmurti) August 25, 2021


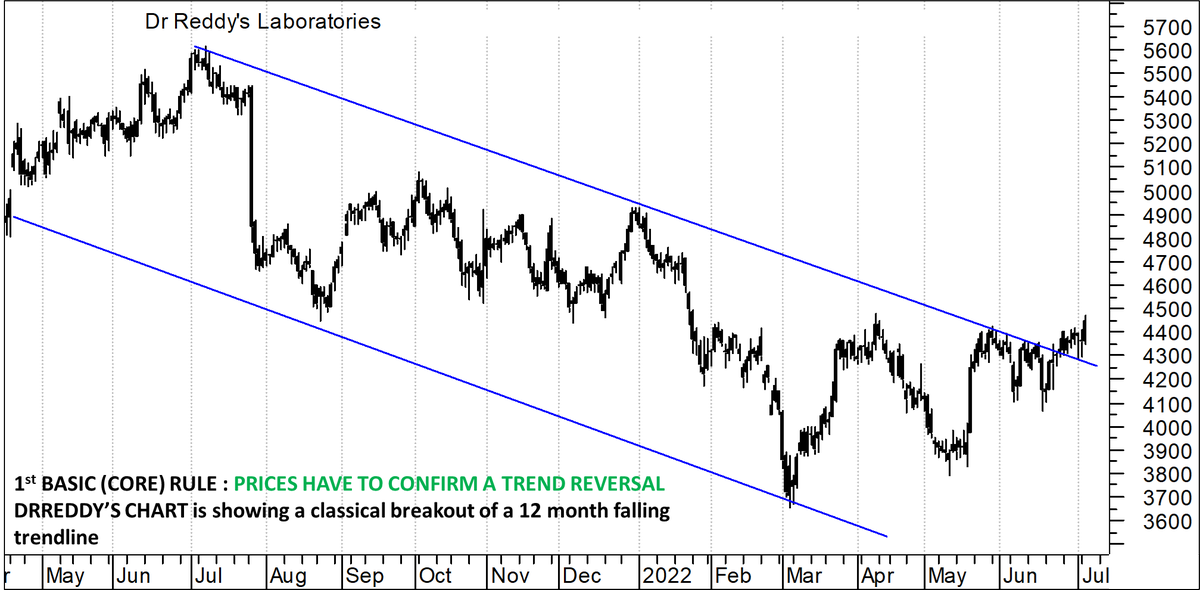
The 3 most important rules which I follow in spotting a major trend reversal laid out in this stock, 'as it is'.
1. Trend reversal
2. Price patterns
3. Indicator confirmation
Perfect TA chart.
All boxes ticked !!
Do comment, like and share !!!
#DRREDDY https://t.co/4JGg71GenE
Today at 2 pm:
— Kunal Bothra (@kbbothra) July 5, 2022
I will bring to you one of the SUPER FINEST TECHNICAL CHART setup on a largecap name.
Agar yeh nahi chal paya toh kuch nahi chal paayega\u2026
Retweeet tsunami has to come for this one\u2026 #stock #breakout #technical
You May Also Like

As someone\u2019s who\u2019s read the book, this review strikes me as tremendously unfair. It mostly faults Adler for not writing the book the reviewer wishes he had! https://t.co/pqpt5Ziivj
— Teresa M. Bejan (@tmbejan) January 12, 2021
The meat of the criticism is that the history Adler gives is insufficiently critical. Adler describes a few figures who had a great influence on how the modern US university was formed. It's certainly critical: it focuses on the social Darwinism of these figures. 2/x
Other insinuations and suggestions in the review seem wildly off the mark, distorted, or inappropriate-- for example, that the book is clickbaity (it is scholarly) or conservative (hardly) or connected to the events at the Capitol (give me a break). 3/x
The core question: in what sense is classics inherently racist? Classics is old. On Adler's account, it begins in ancient Rome and is revived in the Renaissance. Slavery (Christiansen's primary concern) is also very old. Let's say classics is an education for slaveowners. 4/x
It's worth remembering that literacy itself is elite throughout most of this history. Literacy is, then, also the education of slaveowners. We can honor oral and musical traditions without denying that literacy is, generally, good. 5/x

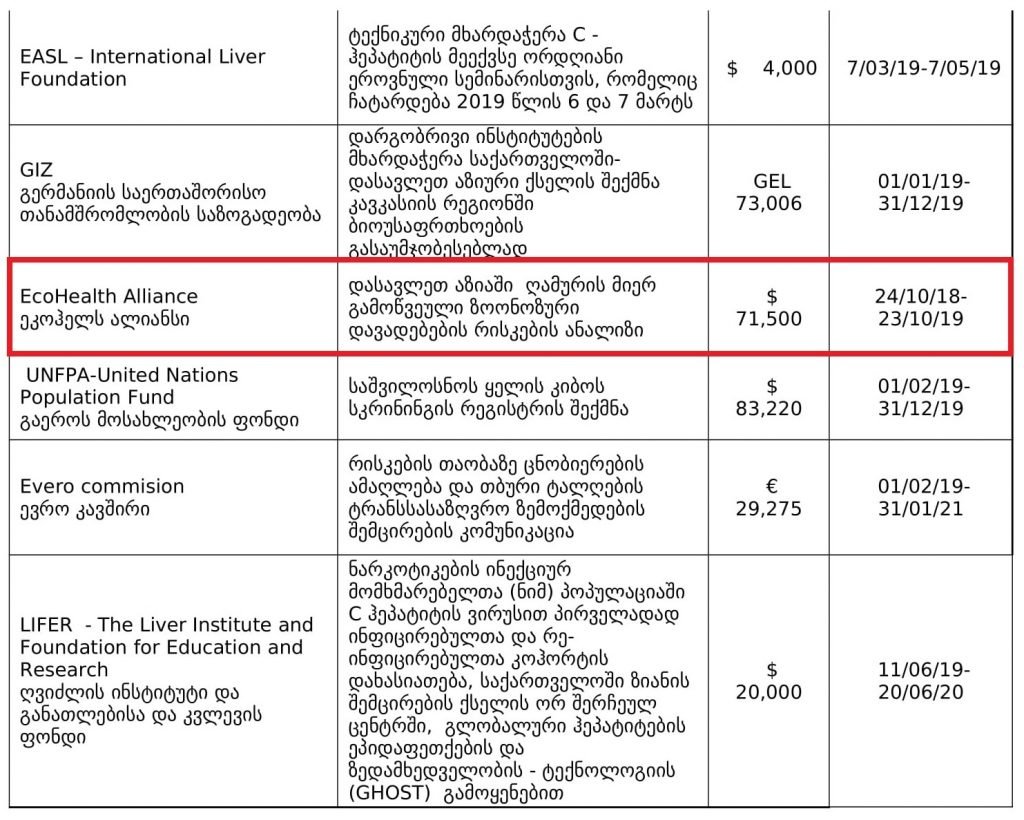
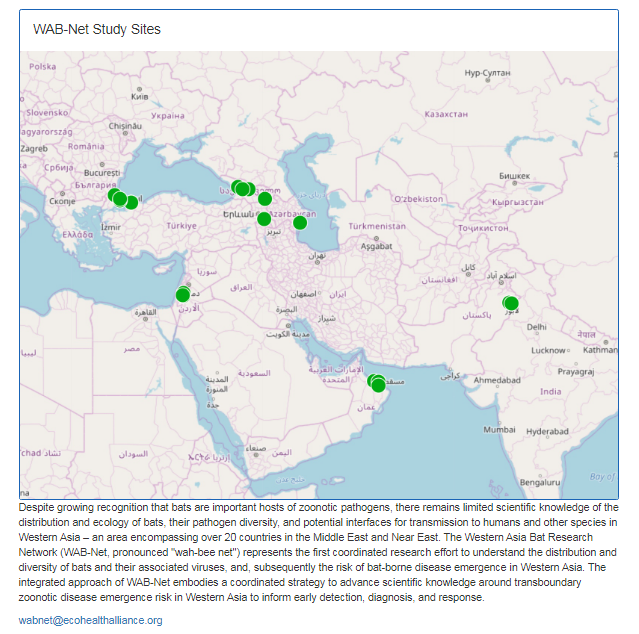
Risks of bat-borne zoonotic diseases in Western Asia
Duration: 24/10/2018-23 /10/2019
Funding: $71,500
@dgaytandzhieva
https://t.co/680CdD8uug
2. Bat Virus Database
Access to the database is limited only to those scientists participating in our ‘Bats and Coronaviruses’ project
Our intention is to eventually open up this database to the larger scientific community
https://t.co/mPn7b9HM48
3. EcoHealth Alliance & DTRA Asking for Trouble
One Health research project focused on characterizing bat diversity, bat coronavirus diversity and the risk of bat-borne zoonotic disease emergence in the region.
https://t.co/u6aUeWBGEN

4. Phelps, Olival, Epstein, Karesh - EcoHealth/DTRA
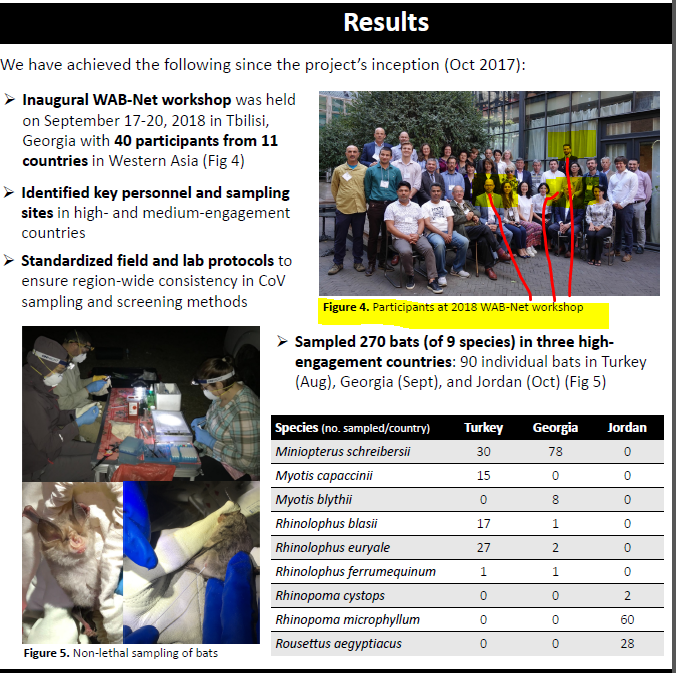
5, Methods and Expected Outcomes
(Unexpected Outcome = New Coronavirus Pandemic)