#Freetip
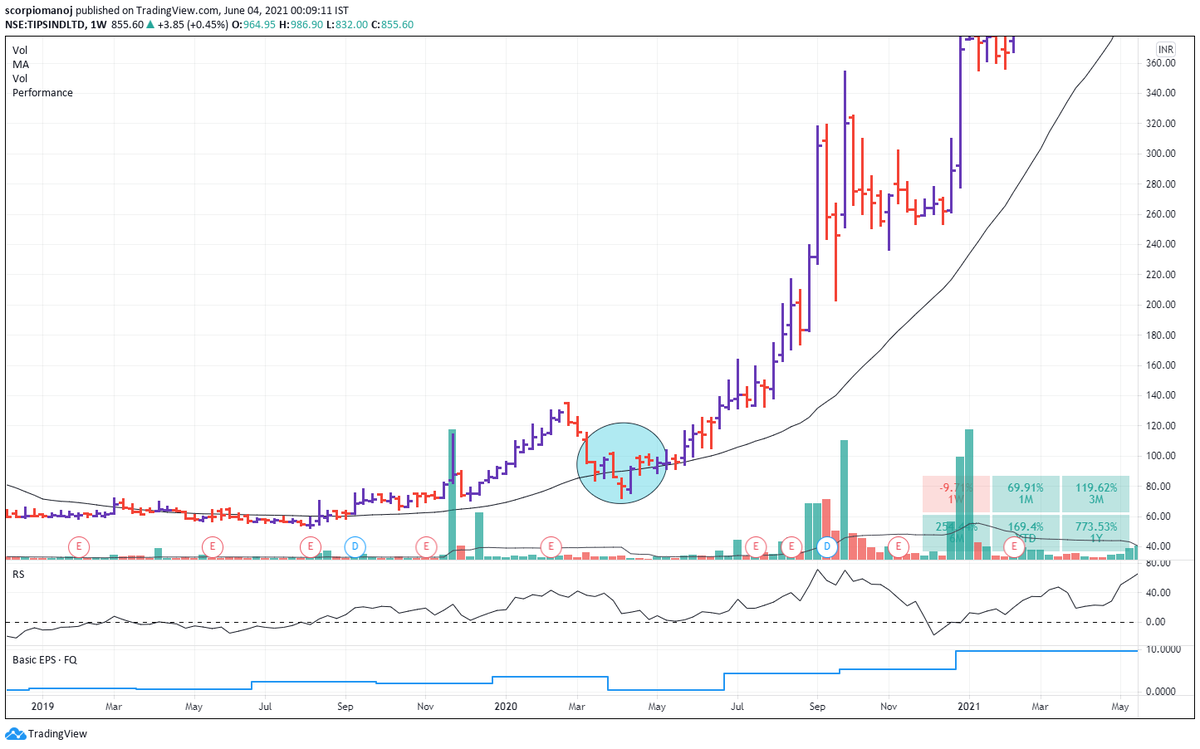
A simple strategy to capture Multibaggers.
1) WklyChart
2) 30 wk MA and 10 Wk MA
3) 10 ma at 45 degree steep.
4) Get ready for long -10 ma crosses 30 ma.
5) Go long on a pullback at 10 MA. 6)Add on pullback at 10 MA.
7) Exit if complete candle closes below 10ma
More from HMK alias MANOJ
More from Screeners


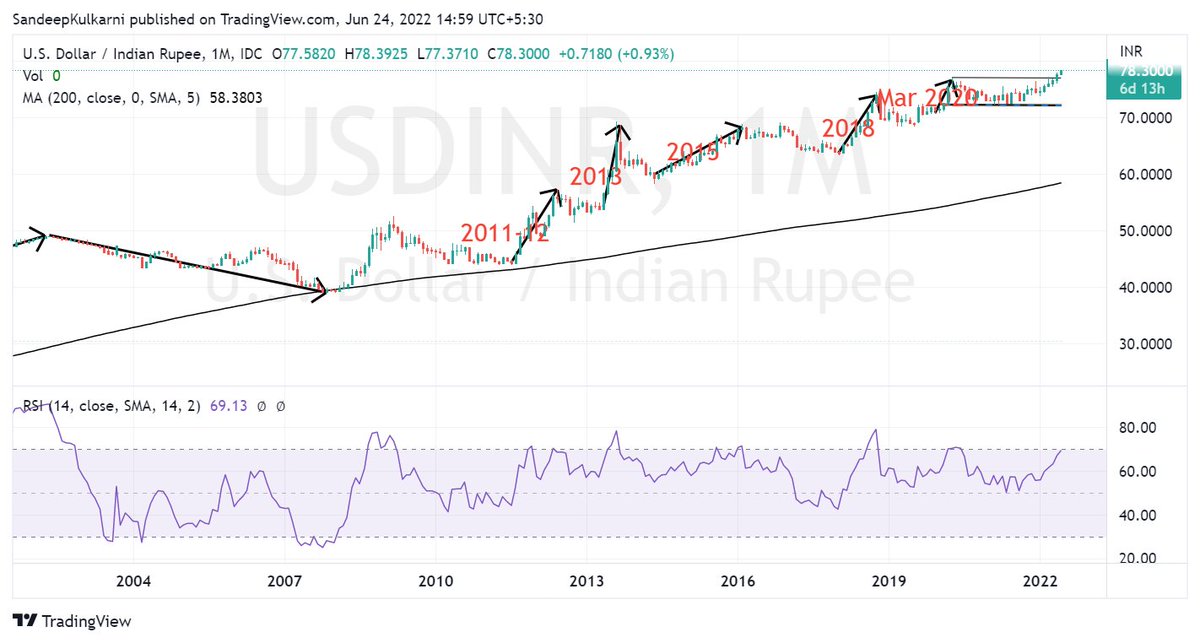
History tells us when #USDINR moves it moves a lot. In that context it has been remarkably resilient with just 8% depreciation. It looks like we are very close to the point from where Rupee will start to appreciating again.
BTW Nifty Metal has inverse correlation with USDINR. https://t.co/X6cqVcYF3V
BTW Nifty Metal has inverse correlation with USDINR. https://t.co/X6cqVcYF3V
We know how our stock market has weathered the FII selling.
— Sandeep Kulkarni (@moneyworks4u_fa) June 10, 2022
But the equally big story is how Rupee has weathered $50bn+ outflows since Oct 2021. Hats off to RBI Governor Das & his team for having the vision of building huge reserves in his tenure. pic.twitter.com/CVuF9dM361