
All Biological life on earth is possible because of a discrete digital mechanism of preservation and replication.
More from Carlos E. Perez
More from Science


Localized Surface Plasmon Resonance - an overview | ScienceDirect Topics
https://t.co/mzS7vVSREJ
https://t.co/353PdAX2fa
https://t.co/3yBImjOdd4
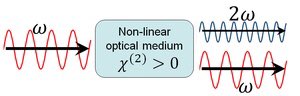
In some cases, almost 100% of the light energy can be converted to the second harmonic frequency. These cases typically involve intense pulsed laser beams passing through large crystals, and careful alignment to obtain phase matching.
https://t.co/mzS7vVSREJ
https://t.co/353PdAX2fa
https://t.co/3yBImjOdd4
In some cases, almost 100% of the light energy can be converted to the second harmonic frequency. These cases typically involve intense pulsed laser beams passing through large crystals, and careful alignment to obtain phase matching.

All modern research questions frame your mindset and self-frame research paradigm. Broad thinking: how little of everything can a citizen survive on; how cheap can your upkeep be? /1
When an American patient lands in an Austrian hospital for a back problem, a doctor tells him to perform a set of exercises.
- How many?
- Do you have anything else to do? /2
This interchange illustrates two mindsets colliding at bedside. How little can I get away with vs there is no limit to effort when it comes to your wellness. /3
When you were robbed of movement, somebody started selling you exercise. To understand that digging a ditch, to build a house, or to carry a child around, or waking to your grandparents for an hour is not the same as jogging on a treadmill... will reveal what research hides.
/4
When I talk about doing a purposeful activity outdoors, I look at complexity of movement, purpose, meaning, sun, and air, even an opportunity to meet a neighbor... that is now reduced to a calcium pill, vitamin D, an antidepressant, an osteoporosis shot, and an oxygen tank. /5
Is moderate exercise enough to live as long as possible, or should you be doing vigorous exercise? And what proportion is best? This article has the answers. https://t.co/YJqpaaI0UR
— Sebastian Rushworth M.D. (@sebrushworth) January 24, 2021
When an American patient lands in an Austrian hospital for a back problem, a doctor tells him to perform a set of exercises.
- How many?
- Do you have anything else to do? /2
This interchange illustrates two mindsets colliding at bedside. How little can I get away with vs there is no limit to effort when it comes to your wellness. /3
When you were robbed of movement, somebody started selling you exercise. To understand that digging a ditch, to build a house, or to carry a child around, or waking to your grandparents for an hour is not the same as jogging on a treadmill... will reveal what research hides.
/4
When I talk about doing a purposeful activity outdoors, I look at complexity of movement, purpose, meaning, sun, and air, even an opportunity to meet a neighbor... that is now reduced to a calcium pill, vitamin D, an antidepressant, an osteoporosis shot, and an oxygen tank. /5
You May Also Like






A list of cool websites you might now know about
A thread 🧵
1) Learn Anything - Search tools for knowledge discovery that helps you understand any topic through the most efficient
2) Grad Speeches - Discover the best commencement speeches.
This website is made by me
3) What does the Internet Think - Find out what the internet thinks about anything
4) https://t.co/vuhT6jVItx - Send notes that will self-destruct after being read.
A thread 🧵
1) Learn Anything - Search tools for knowledge discovery that helps you understand any topic through the most efficient
2) Grad Speeches - Discover the best commencement speeches.
This website is made by me
3) What does the Internet Think - Find out what the internet thinks about anything
4) https://t.co/vuhT6jVItx - Send notes that will self-destruct after being read.

![Peter McCormack [Jan/3\u279e\u20bf \U0001f511\u220e]](https://pbs.twimg.com/profile_images/1524287442307723265/_59ITDbJ_normal.jpg)