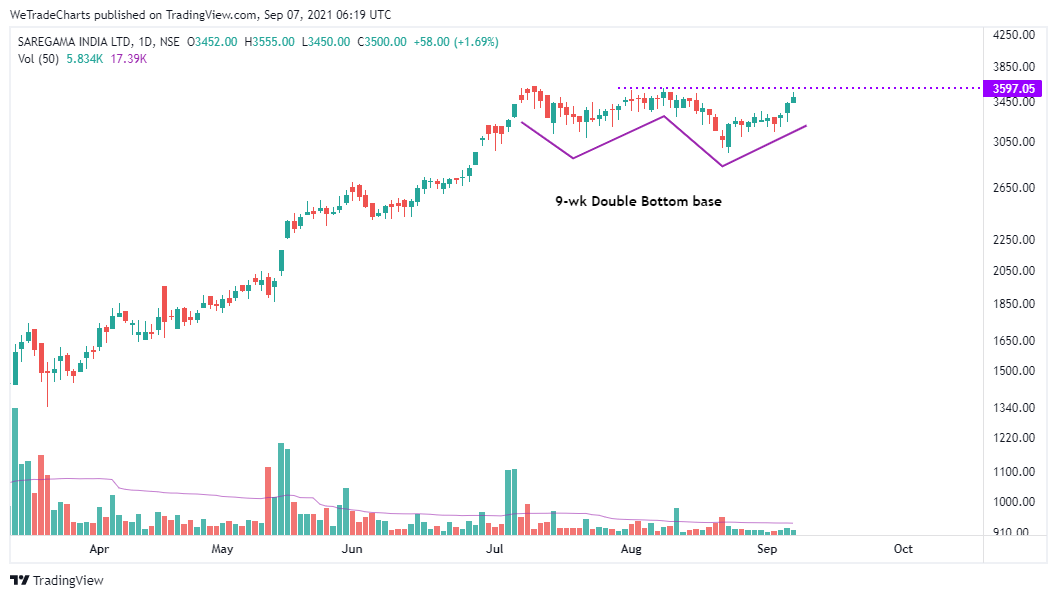
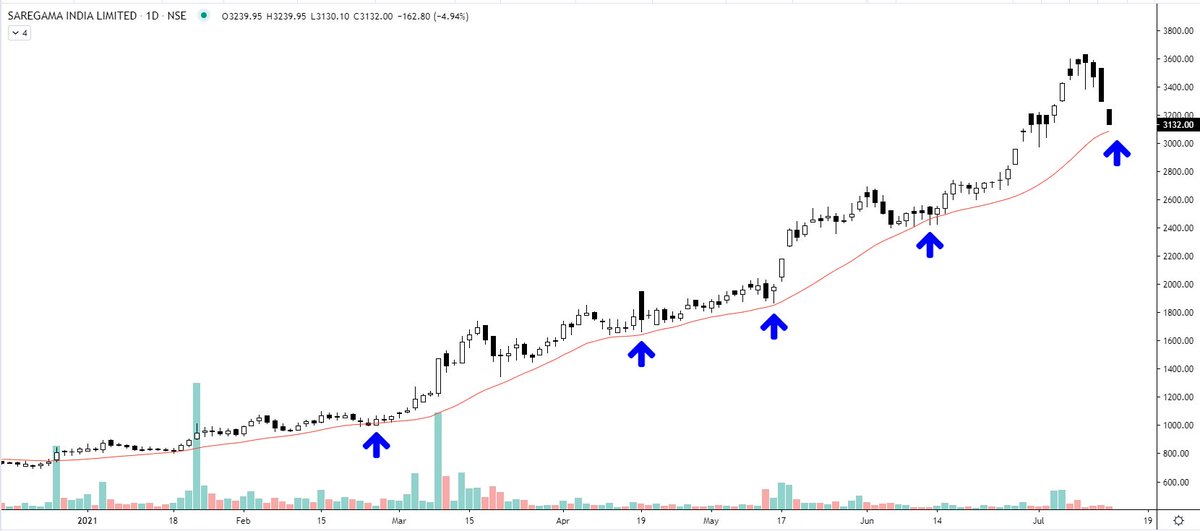
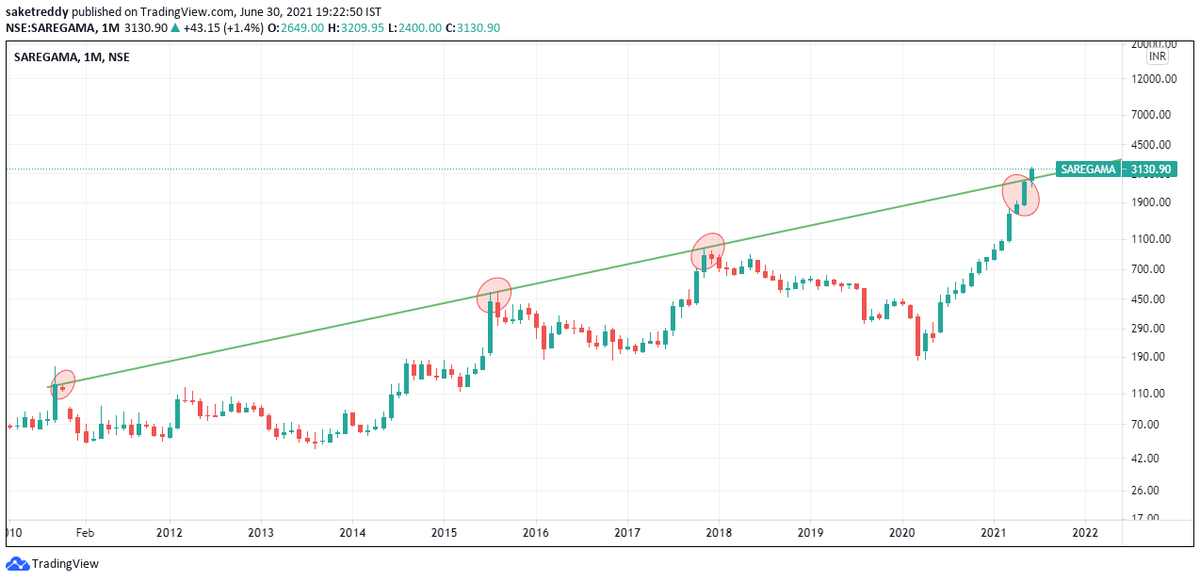
Saregama - 🎹🎶🎼🎵
Will it respect the 20 EMA again? So far, no serious selling. Price coming down with negligible volumes.
More from Steve Nison
More from Saregama

SAREGAMA
Double Top Buy & T20 Pattern - Bullish triggered above 3596.76 daily close on 3% Box Size chart. https://t.co/130vDnOAzm

Double Top Buy & T20 Pattern - Bullish triggered above 3596.76 daily close on 3% Box Size chart. https://t.co/130vDnOAzm
SAREGAMA
— Saket Reddy (@saketreddy) July 15, 2021
Double Top Buy & T20 Pattern - Bullish above 3601.56 daily close on 1% Box Size chart. https://t.co/3514cyjgDH pic.twitter.com/pdlyX1pdre
SAREGAMA
Today's closing is a monthly close and this is done & dusted, we now have a solid monthly close above the 10 year supply zone.
If the stock has broken out from a 10 year supply zone & a 20 year peak, surely something would've changed!
Do study the industry structure! https://t.co/zA3qztFzon
Today's closing is a monthly close and this is done & dusted, we now have a solid monthly close above the 10 year supply zone.
If the stock has broken out from a 10 year supply zone & a 20 year peak, surely something would've changed!
Do study the industry structure! https://t.co/zA3qztFzon
SAREGAMA at a very important juncture now on the monthly chart considering today's close is also a monthly close.
— Saket Reddy (@saketreddy) May 31, 2021
Nearing a breakout from over a 10 year supply zone! https://t.co/qpsSn3obrE pic.twitter.com/1xTmB6WvhK