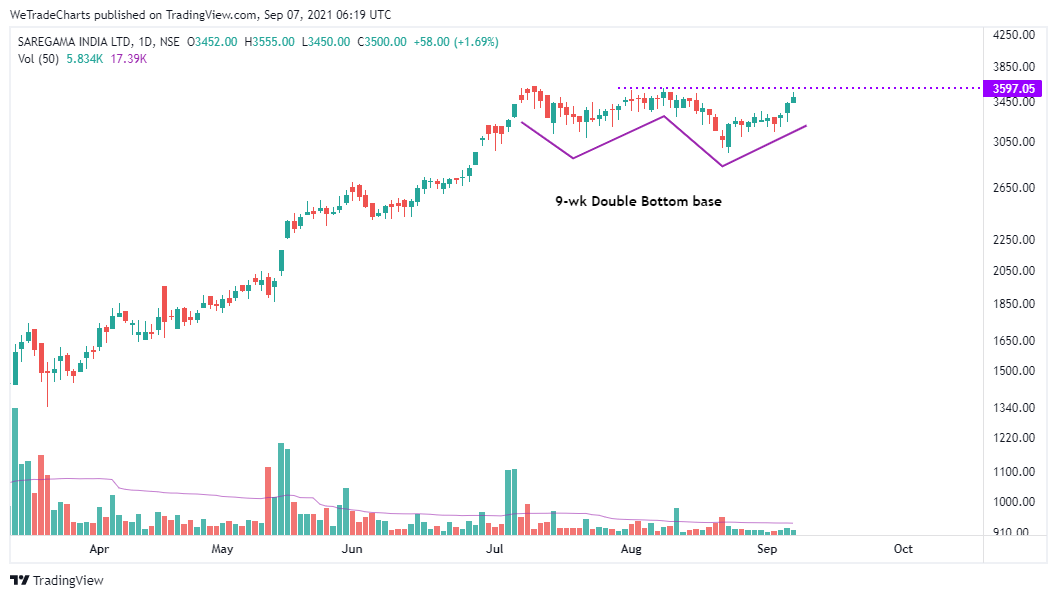
LEARNING ⭕️
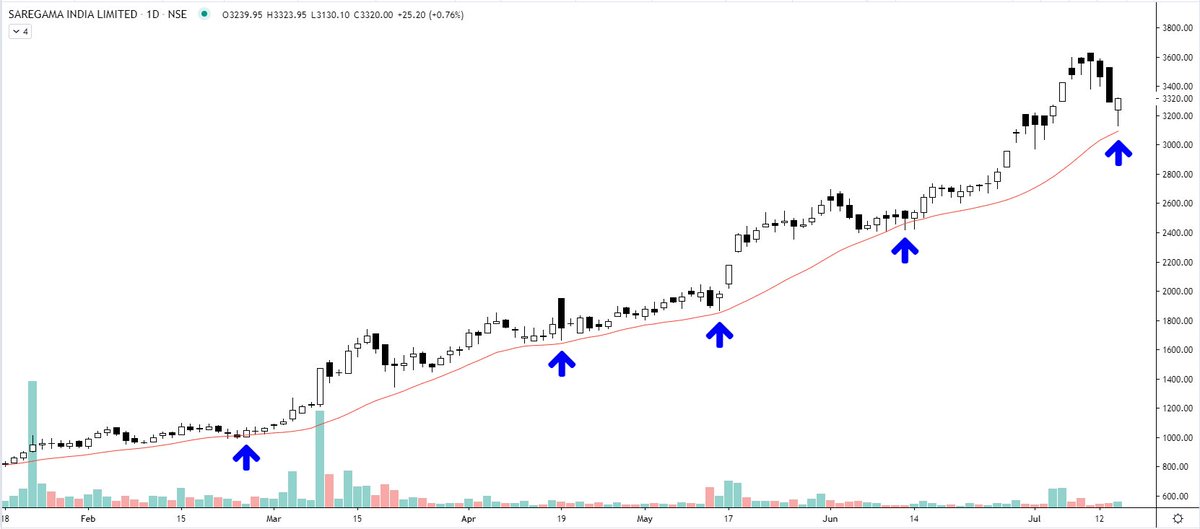
Saregama - Simple MA strategy working well. A price constantly testing 20 EMA and bouncing back is the one that is in a strong uptrend. If you miss any one of the strongest stocks during a breakout, observe its reaction as it comes near 20 EMA again and hunt it down.
Saregama - \U0001f3b9\U0001f3b6\U0001f3bc\U0001f3b5
— Steve Nison (@nison_steve) July 14, 2021
Will it respect the 20 EMA again? So far, no serious selling. Price coming down with negligible volumes. pic.twitter.com/CEB6OTJssd
More from Steve Nison

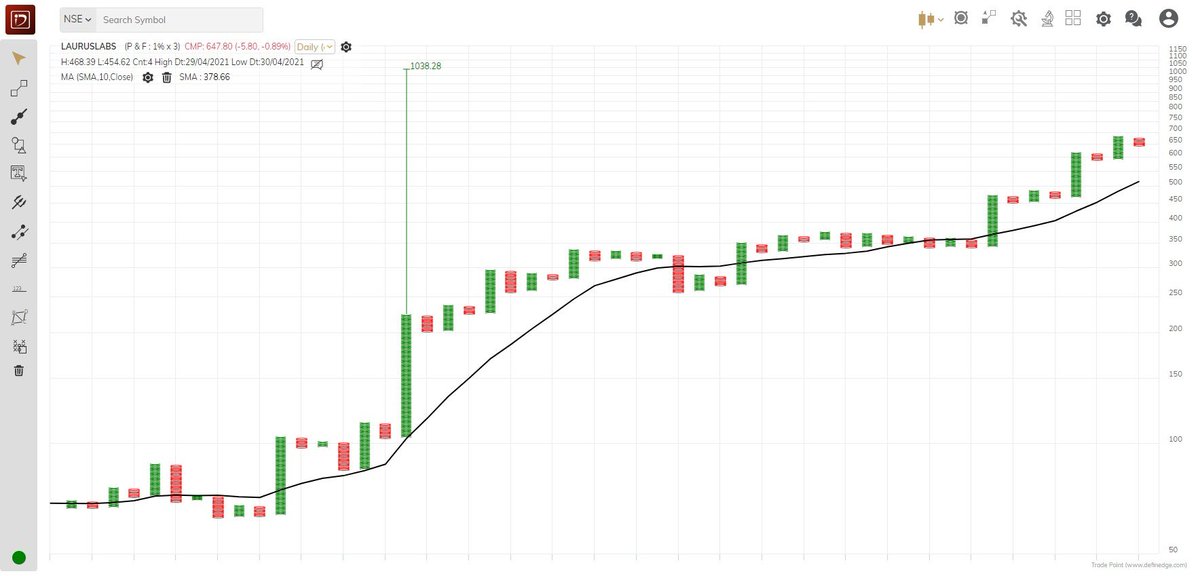
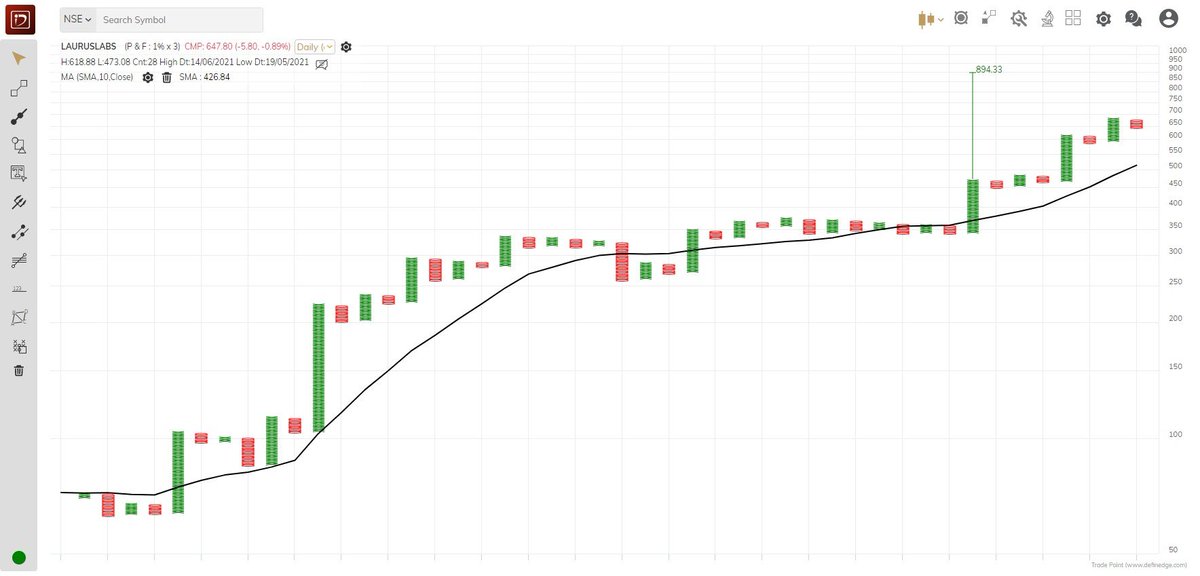
Deepak nitrite
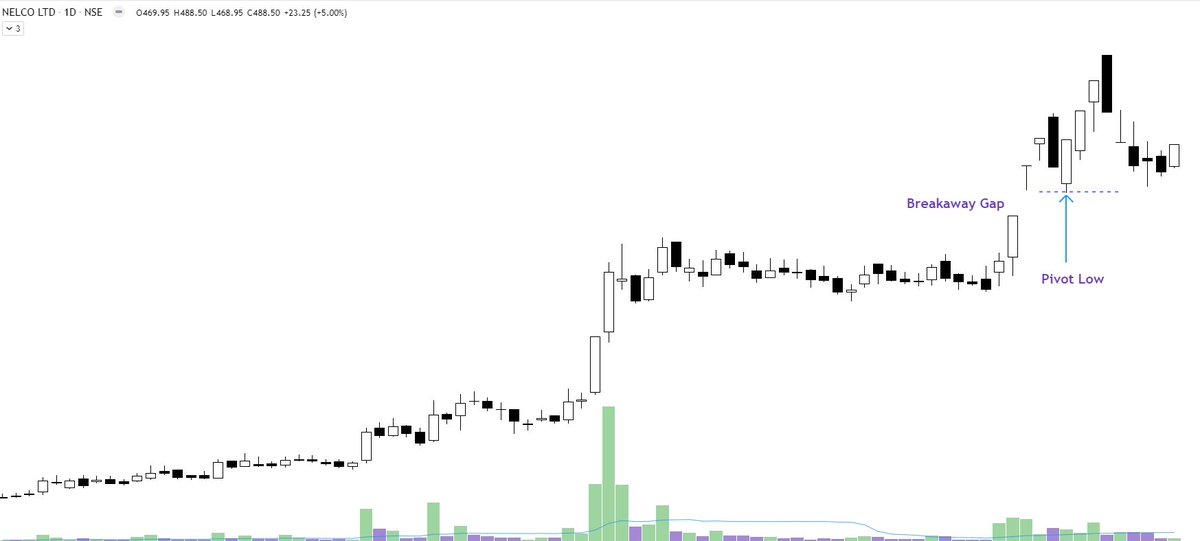
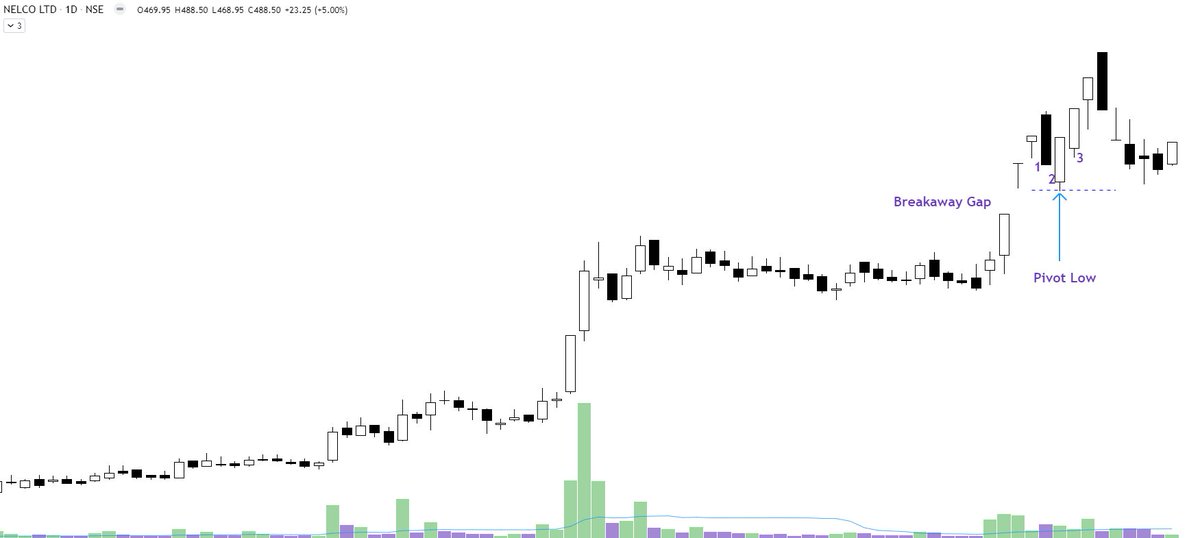
Explained you same concept with Elxsi. The real test of a strong Breakout is that the big hand will not give you another chance to buy the share at the breakout level. They will absorb all the selling of weak hands. I mean "STRONG breakout". https://t.co/7fxFqGQl3p
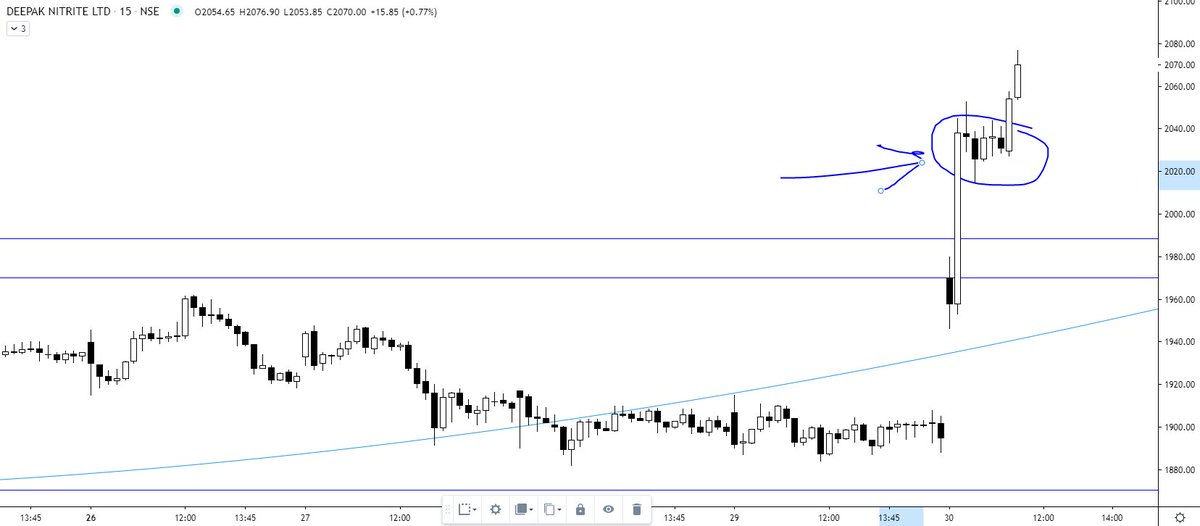
Explained you same concept with Elxsi. The real test of a strong Breakout is that the big hand will not give you another chance to buy the share at the breakout level. They will absorb all the selling of weak hands. I mean "STRONG breakout". https://t.co/7fxFqGQl3p
Tata Elxsi ---
— Steve Nison (@nison_steve) June 30, 2021
In the last 10 minutes, all the selling was absorbed despite intraday positions being squared off (if not converted). will wait for the EOD data. However, the chart structure is extremely strong. https://t.co/pci7GCDBEO pic.twitter.com/1NBD9V3mKc
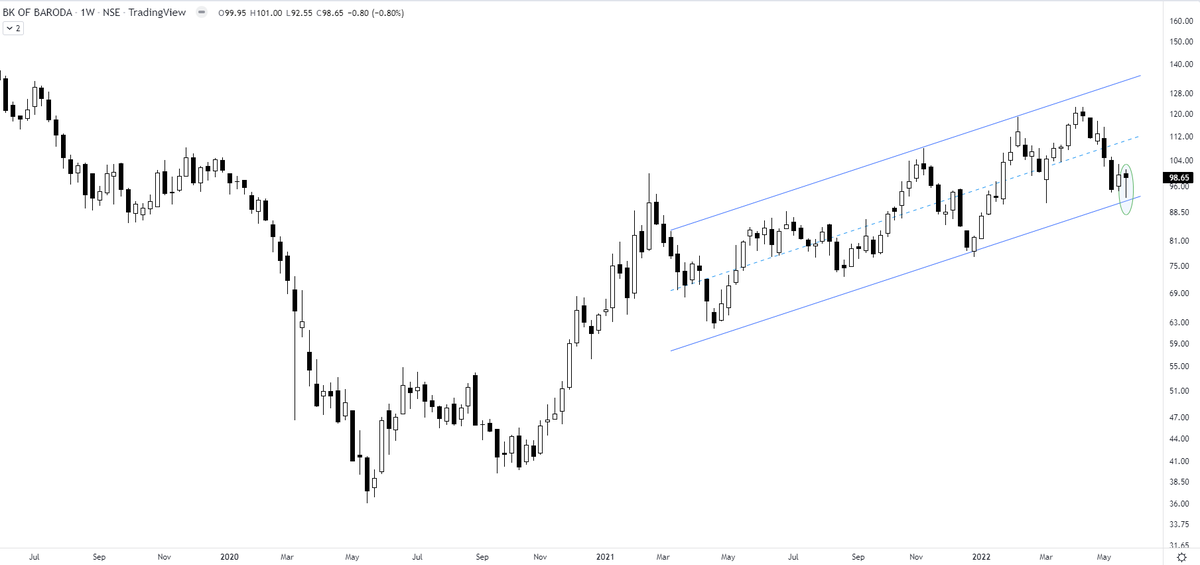
The channel formation is still unhindered. A beautiful price pattern at work in ITC. For investors, the best way is to add when the price comes near the lower boundary. https://t.co/2Nw9fLQPsm
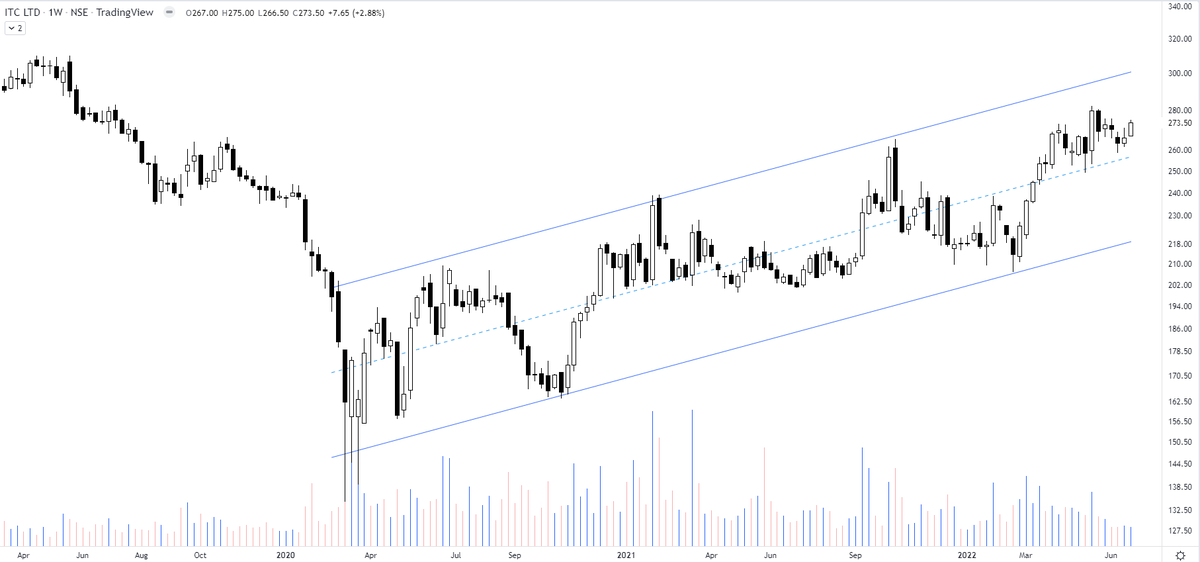
ITC - how beautifully the price patterns work. All of a sudden an increased momentum right from the support of the channel boundary. Has a minor resistance to nail down in the middle.
— The_Chartist \U0001f4c8 (@charts_zone) March 18, 2022
Anyone observing it would have gone aggressive at lower end for a swing move pic.twitter.com/YqxkdFlJXQ
More from Saregama

#saregama
How Beautifully Price is giving respect to Trendline. https://t.co/55F37IKfKG
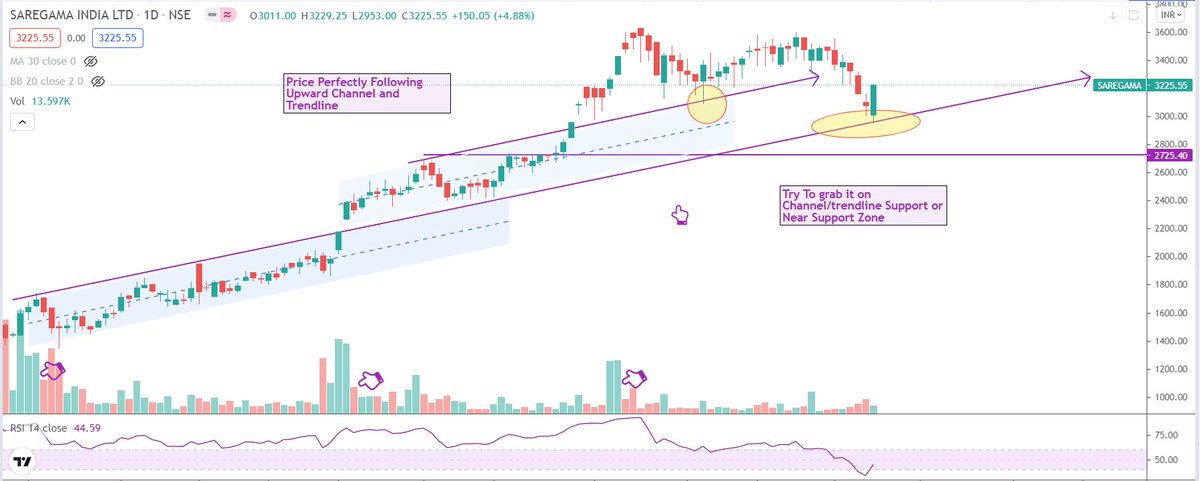
How Beautifully Price is giving respect to Trendline. https://t.co/55F37IKfKG
Time & Price Correction Came
— Market Learner \U0001f3af (@MarketLearner7) July 30, 2021
Taking supports as per mentioned levels &
Ready to bounce back
Multi-Bagger Giving Opportunity
Now its time to show execution power #LaurusLab #Saregama@jainchintan67 @RajarshitaS @ca_mehtaravi @nid_rockz https://t.co/95N2zTOCfr pic.twitter.com/jzhipRyBVs


SAREGAMA
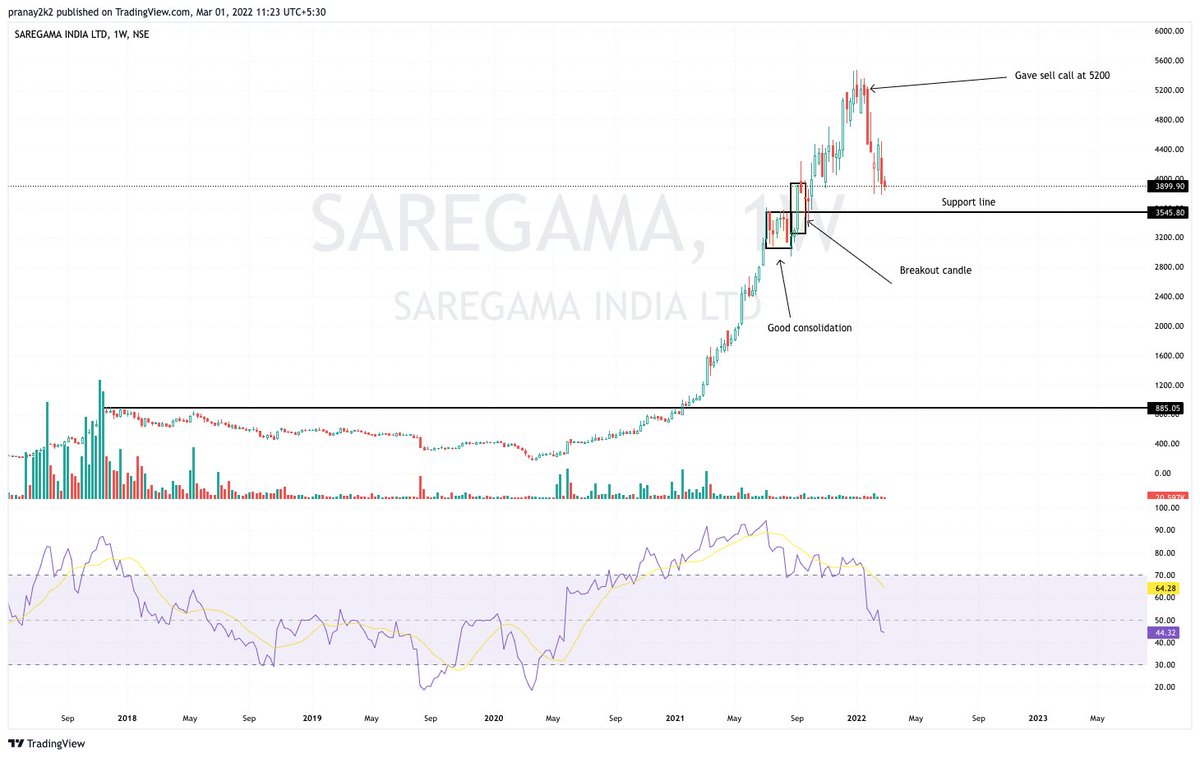
Double Top Buy & T20 Pattern - Bullish triggered above 3596.76 daily close on 3% Box Size chart. https://t.co/130vDnOAzm

Double Top Buy & T20 Pattern - Bullish triggered above 3596.76 daily close on 3% Box Size chart. https://t.co/130vDnOAzm
SAREGAMA
— Saket Reddy (@saketreddy) July 15, 2021
Double Top Buy & T20 Pattern - Bullish above 3601.56 daily close on 1% Box Size chart. https://t.co/3514cyjgDH pic.twitter.com/pdlyX1pdre
SAREGAMA
Today's closing is a monthly close and this is done & dusted, we now have a solid monthly close above the 10 year supply zone.
If the stock has broken out from a 10 year supply zone & a 20 year peak, surely something would've changed!
Do study the industry structure! https://t.co/zA3qztFzon
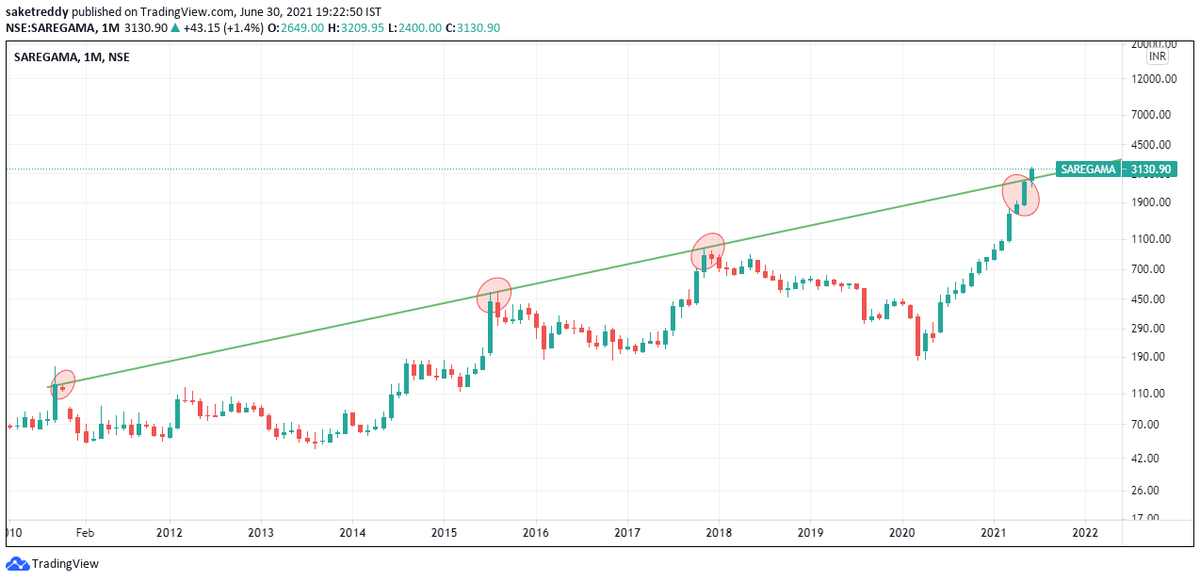
Today's closing is a monthly close and this is done & dusted, we now have a solid monthly close above the 10 year supply zone.
If the stock has broken out from a 10 year supply zone & a 20 year peak, surely something would've changed!
Do study the industry structure! https://t.co/zA3qztFzon
SAREGAMA at a very important juncture now on the monthly chart considering today's close is also a monthly close.
— Saket Reddy (@saketreddy) May 31, 2021
Nearing a breakout from over a 10 year supply zone! https://t.co/qpsSn3obrE pic.twitter.com/1xTmB6WvhK