You are seriously missing a lot of information if you are not maintaining a trading journal. It is much better if you also take a snap of the charts you trade for the post-analysis.
This exercise will tell you about your inherent strengths & weaknesses. 👇👇
How to record a trading journal (TJ) & what to analyze?
— The_Chartist \U0001f4c8 (@charts_zone) December 14, 2021
What is in a TJ?
Buy Date
Stock Name
The time frame you analyzed (D/W/M)
Long/Short?
Buy Price
SL
Sell Price
Risk took (% of capital)
Sell date
No. of days held
P/L
P/L as % of capital
Buy Reason?
Invested capital/trade pic.twitter.com/WnrvmYuOV0
More from The_Chartist 📈
I believe 5-10 stocks are enough for a retail investor to achieve super performance. And with small capital, there is no point in buying 20/30 names which doesn't even get appropriate initial capital.
Stock: CDSL
— Steve Nison (@nison_steve) December 16, 2020
CMP - 516.95. Low risk setup. Weak below 500. Target open. Stock retesting the ascending triangle BO line. Kindly check please. @nishkumar1977 @Rishikesh_ADX @VijayThk @kuttrapali @Thekalal @PAVLeader pic.twitter.com/PlcpOMsdnz
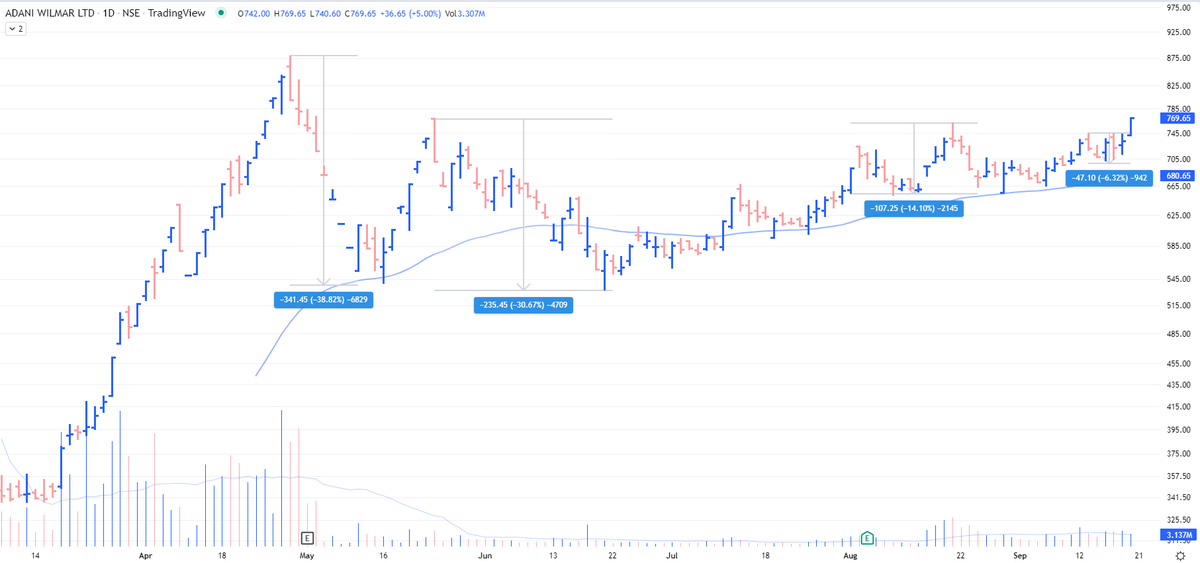
AWL - look at the ranges of contraction on the chart https://t.co/2XMhqZQu8X
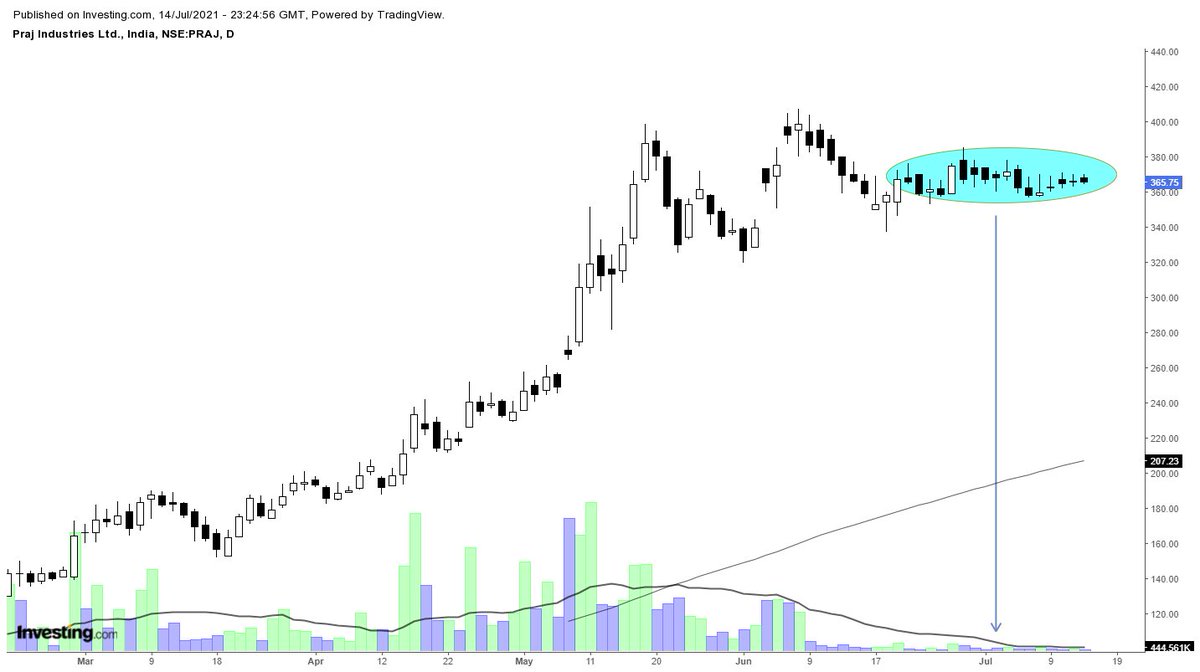
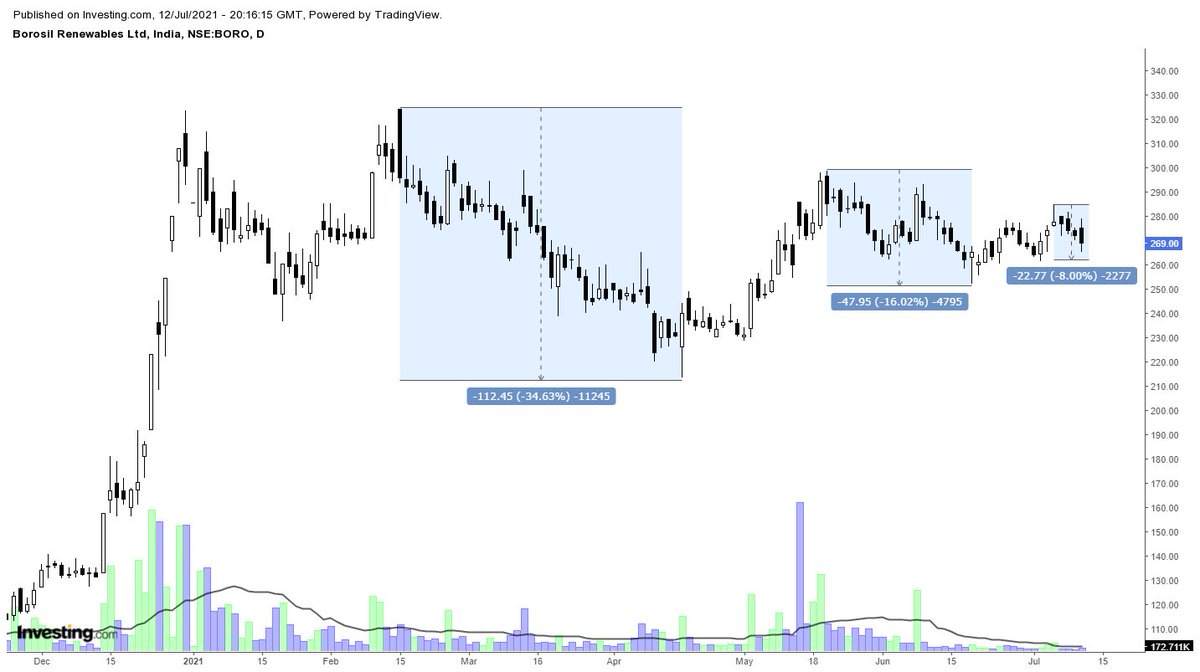
Borosil Renewables - Patterns like these must be looked at carefully and must be kept on the radar. Herein price is contracting which generally signifies shifting of hands (from weak to strong). If you go wrong, the risk is limited in these. pic.twitter.com/iqyoeslZjy
— The_Chartist \U0001f4c8 (@charts_zone) July 12, 2021
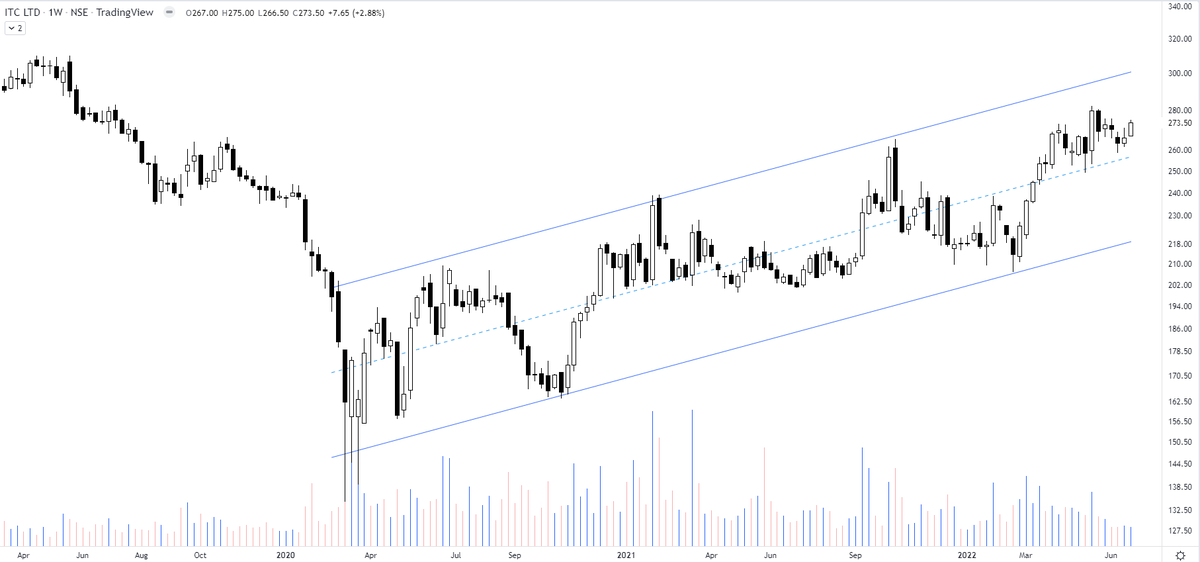
ITC - how beautifully the price patterns work. All of a sudden an increased momentum right from the support of the channel boundary. Has a minor resistance to nail down in the middle.
— The_Chartist \U0001f4c8 (@charts_zone) March 18, 2022
Anyone observing it would have gone aggressive at lower end for a swing move pic.twitter.com/YqxkdFlJXQ
You May Also Like

He has been wrong (or lying) so often that it will be nearly impossible for me to track every grift, lie, deceit, manipulation he has pulled. I will use...

... other sources who have been trying to shine on light on this grifter (as I have tried to do, time and again:
Ivor Cummins BE (Chem) is a former R&D Manager at HP (sourcre: https://t.co/Wbf5scf7gn), turned Content Creator/Podcast Host/YouTube personality. (Call it what you will.)
— Steve (@braidedmanga) November 17, 2020
Example #1: "Still not seeing Sweden signal versus Denmark really"... There it was (Images attached).
19 to 80 is an over 300% difference.
Tweet: https://t.co/36FnYnsRT9

Example #2 - "Yes, I'm comparing the Noridcs / No, you cannot compare the Nordics."
I wonder why...
Tweets: https://t.co/XLfoX4rpck / https://t.co/vjE1ctLU5x

Example #3 - "I'm only looking at what makes the data fit in my favour" a.k.a moving the goalposts.
Tweets: https://t.co/vcDpTu3qyj / https://t.co/CA3N6hC2Lq