I see a lot of traders following classical chart patterns . Being a pattern follower myself for some years , here is my advice to them as I feel some pointers will improve their accuracy . Again , this is not the only correct way but what I have learnt from my experiences
More from Subhadip Nandy


IV - A thread
In financial mathematics, implied volatility of an option contract is
that value of the volatility of the underlying instrument which, when
input in an option pricing model ) will return a theoretical value equal to the current market price of the option (1/n)
Implied volatility, a forward-looking and subjective measure, differs
from historical volatility because the latter is calculated from known
past returns of a security. .
https://t.co/iC5wVf7kvj (2/n)
To understand where Implied Volatility stands in terms of the underlying, implied volatility rank is used to understand its implied volatility from a one year high and low IV.
https://t.co/NFPOidRRcH
https://t.co/qNqinEqaKY
(3/n)
Options traders are always looking at the IV and IVR/IVP. For option
buyers, a low IV environment is best to initiate positions as the
subsequent rise in IV actually helps their positions . Even if the IV
remains flat, the position is not hurt by volatility (4/n)
Option sellers on the other hand are looking for high IV scenarios, where
the subsequent fall in IV ( known a vol crush , most often seen after
earnings/events) helps their positions. Here also, if the IV does not
rise, it does not hurt a seller's positions (5/n)
Perhaps you have the idea that calling me " 1 lot Nandy" is somehow derogatory and a easy poke at me. Allow me to explain why I look at this moniker as a badge of honour
I have traded 1 lot continuously twice in my life. The first in 2003 after I blew up on my INFY trade. I traded 1 lot ACC fut consistently and made 50k in a month
The 2nd time in 2013. When I suffered continuous losses for 5-6 months due to a variety of psychological issues. Then I traded 1 lot Nifty options consistently for 3 months. After that 2 lots for next 1 month and slowly increased
I have shared these two incidents on my various interveiws and regularly share this in detail with my handholding students when I talk about trading psychology.
This logic of trading 1 lot to iron out trading issues I learnt from the interview of Anthony Saliba, who traded 1 lot in options for 6 months. BTW, Saliba was the only options trader to have been profiled on the original Market Wizards ( I read his interview and used his logic)
Sir itseems people call you as "one lot Nandy".. Is it true?
— Bittu (@nanoobittu) July 16, 2021
I have traded 1 lot continuously twice in my life. The first in 2003 after I blew up on my INFY trade. I traded 1 lot ACC fut consistently and made 50k in a month
The 2nd time in 2013. When I suffered continuous losses for 5-6 months due to a variety of psychological issues. Then I traded 1 lot Nifty options consistently for 3 months. After that 2 lots for next 1 month and slowly increased
I have shared these two incidents on my various interveiws and regularly share this in detail with my handholding students when I talk about trading psychology.
This logic of trading 1 lot to iron out trading issues I learnt from the interview of Anthony Saliba, who traded 1 lot in options for 6 months. BTW, Saliba was the only options trader to have been profiled on the original Market Wizards ( I read his interview and used his logic)
This question might have rose in your mind too, that why VIX was lower than yesterday despite the huge selloff today.
This is what I think happens . A thread.
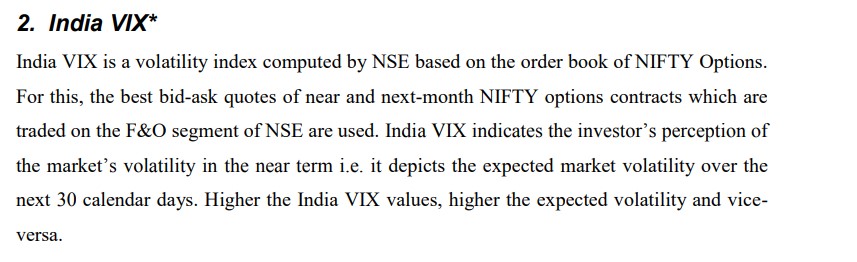
What is VIX ?
https://t.co/VOkAwGRsHL
What is IV ( implied volatility ) ?
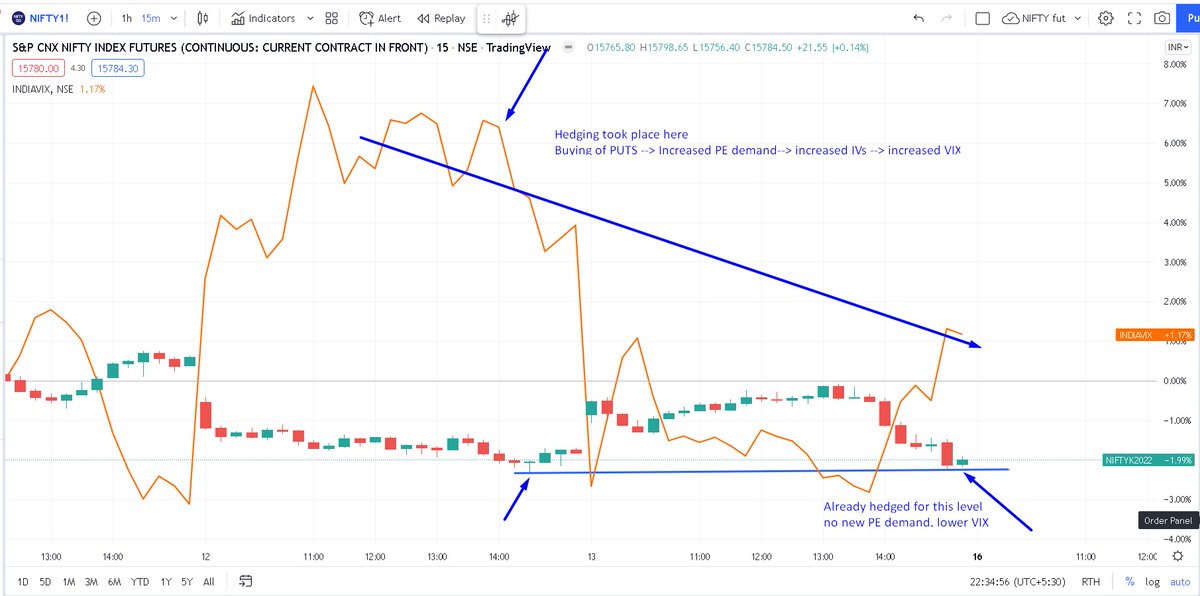
Now my explanations. IV is simply demand and supply. IV is back calculated from option prices and not given by the BSM model. When demand for options ( by buyers) are high, IVs will be high. When supply of options ( by sellers) are high, IV will be low.
Now look at this chart. Nifty fut and VIX are plotted together ( red line is the VIX). Yesterday's massive breakdown forced traders to hedge their positions by buying puts ( could be cash holdings, could be future longs, could be sold puts). This excess demand spiked up IVs /VIX
This is what I think happens . A thread.
Market is highly volatile but vix is down by 4%
— Jegathesan Durairaj (Jegan) (@itjegan) May 13, 2022
What is VIX ?
https://t.co/VOkAwGRsHL
What is IV ( implied volatility ) ?
Now my explanations. IV is simply demand and supply. IV is back calculated from option prices and not given by the BSM model. When demand for options ( by buyers) are high, IVs will be high. When supply of options ( by sellers) are high, IV will be low.
Now look at this chart. Nifty fut and VIX are plotted together ( red line is the VIX). Yesterday's massive breakdown forced traders to hedge their positions by buying puts ( could be cash holdings, could be future longs, could be sold puts). This excess demand spiked up IVs /VIX