Strong #Breakout #Stocks!
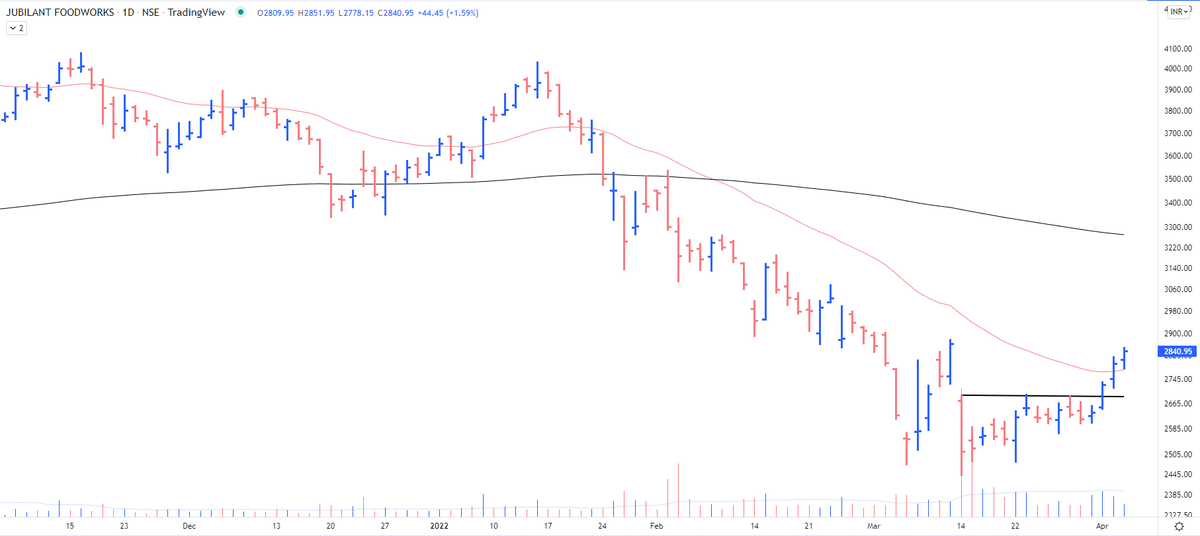
⚡️#JUBLFOOD
⚡️#MSTC
⚡️#MOL
⚡️#ASTRAMICRO
Keep on Radar.
What is your Breakout stock pick ???
For more such trades setups and charts, join #Telegram Channel⤵️
https://t.co/FSyDMaYePf
#stocks #trading #watchlist
More from The Chartians
And Edge comes with Data and Resources.
But 90% of Retail don’t have access to authentic educational data.
This compilation is surely a 50,000₹ Technical Analysis’s course in itself 🧵
https://t.co/PTeE1Hms9Y
Trading on chart patterns is difficult, Until you see this:
— The Chartians (@chartians) August 6, 2022
Free Technical Analysis course (1/10) \U0001f9f5
https://t.co/2JvDpSzHds
Trading on chart patterns is difficult, Until you read this ! \u26a1\ufe0f
— The Chartians (@chartians) August 21, 2022
Everything about Cup and Handle Pattern
Free Technical Analysis course (2/10) \U0001f9f5
https://t.co/QuX8o1MUbo
Trading on chart patterns is difficult until you read this !\u26a1\ufe0f
— The Chartians (@chartians) August 28, 2022
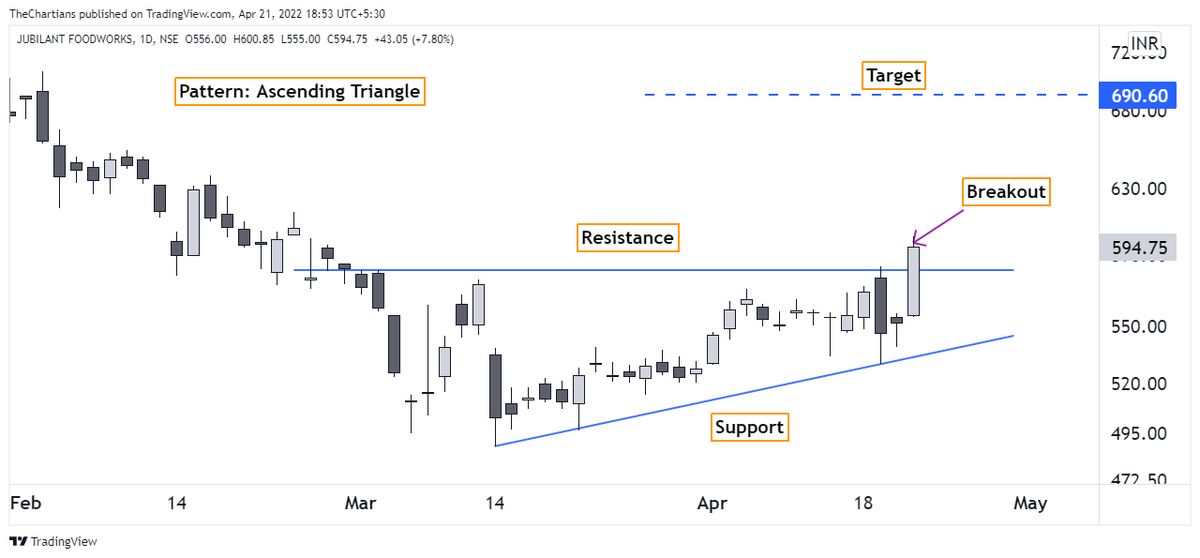
Everything about Ascending Triangle Pattern
Free Technical Analysis course (3/10) \U0001f9f5
https://t.co/5dBdHq9CBY
Trading on chart patterns is difficult, Until you read this ! \u26a1\ufe0f
— The Chartians (@chartians) October 9, 2022
Everything about Head and Shoulder Pattern
Free Technical Analysis course (4/10) \U0001f9f5


More from Jublfood

Jubilant Foodworks - updated chart https://t.co/mH1TTqHbcq
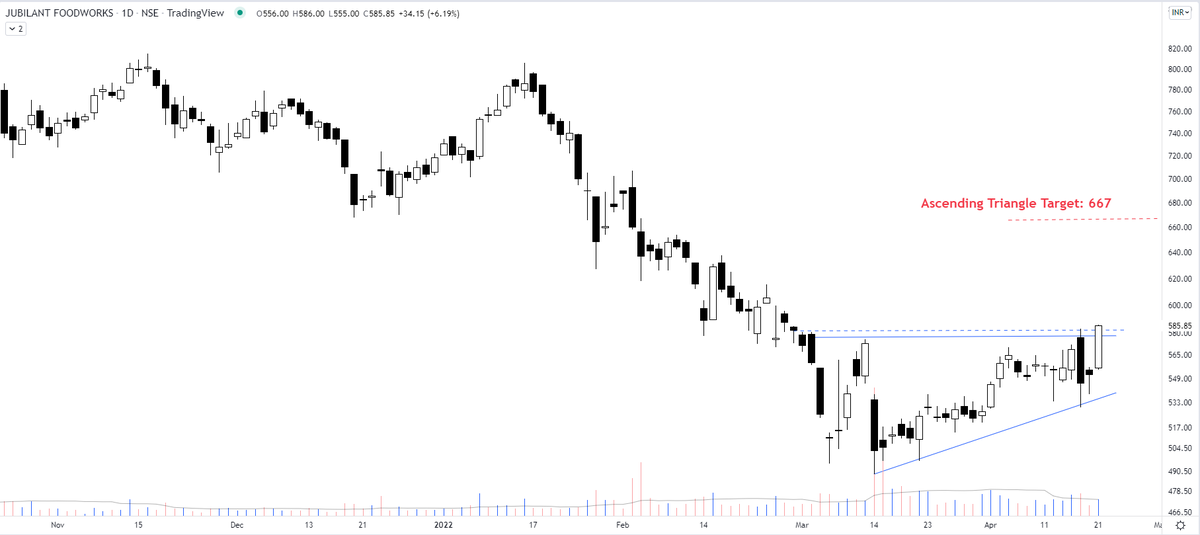
Post the capitulation move, I am anticipating an ascending triangle breakout in Jubilant Foodworks however the buy is not triggered yet. That target open would be 667.
— The_Chartist \U0001f4c8 (@charts_zone) April 21, 2022
Ascending triangles also act as key reversal patterns. https://t.co/M1vLYEsngf pic.twitter.com/f06rbJhLaq


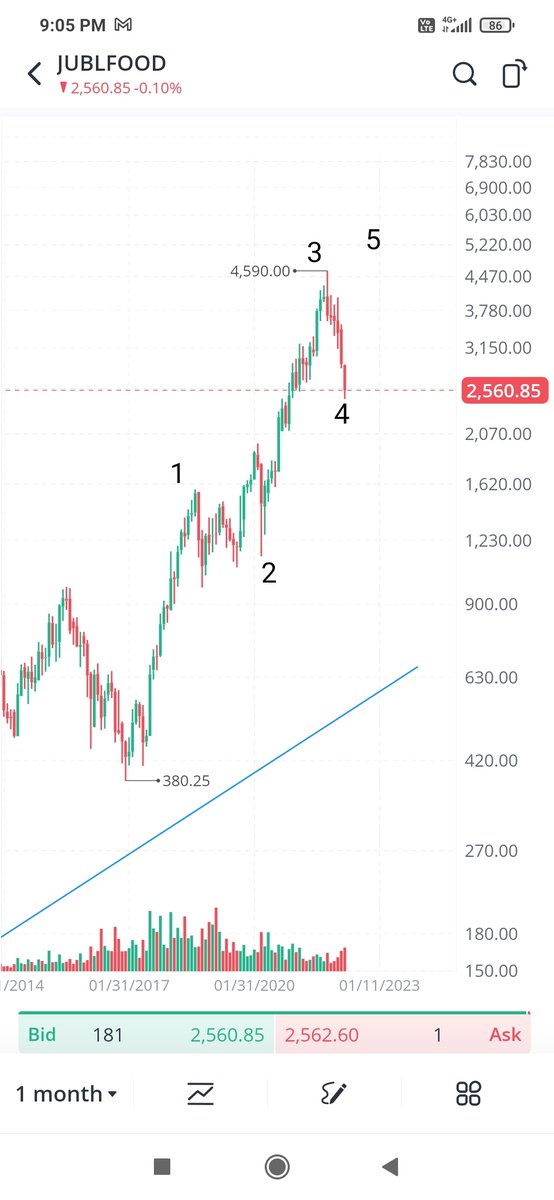
~ capitulation move
~ no further selling left
~ a major TL validated on a weekly scale
~ highest R:R ratio
With such capitulation & tight SL = capital put in was 30%
Risk = 50, Reward = 350
Jubilant Food https://t.co/M1vLYEsngf
The selling climax is accompanied by volume bars of such magnitude that I highlighted in the chart. In almost all cases, they signify that even the last bull has thrown in the towel & there is no further selling left. Will observe in this case.
— The_Chartist \U0001f4c8 (@charts_zone) March 15, 2022
Jubilant Food pic.twitter.com/j7bGSdhkRW