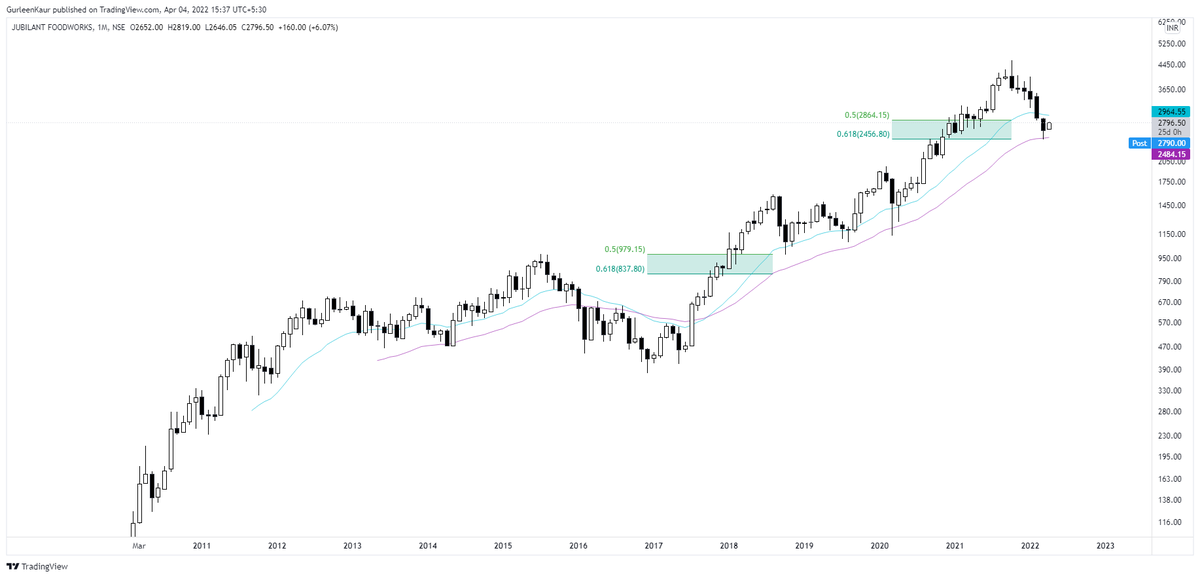
Reasons for taking this trade violating the stock price < 200MA were:
~ capitulation move
~ no further selling left
~ a major TL validated on a weekly scale
~ highest R:R ratio
With such capitulation & tight SL = capital put in was 30%
Risk = 50, Reward = 350
Jubilant Food https://t.co/M1vLYEsngf
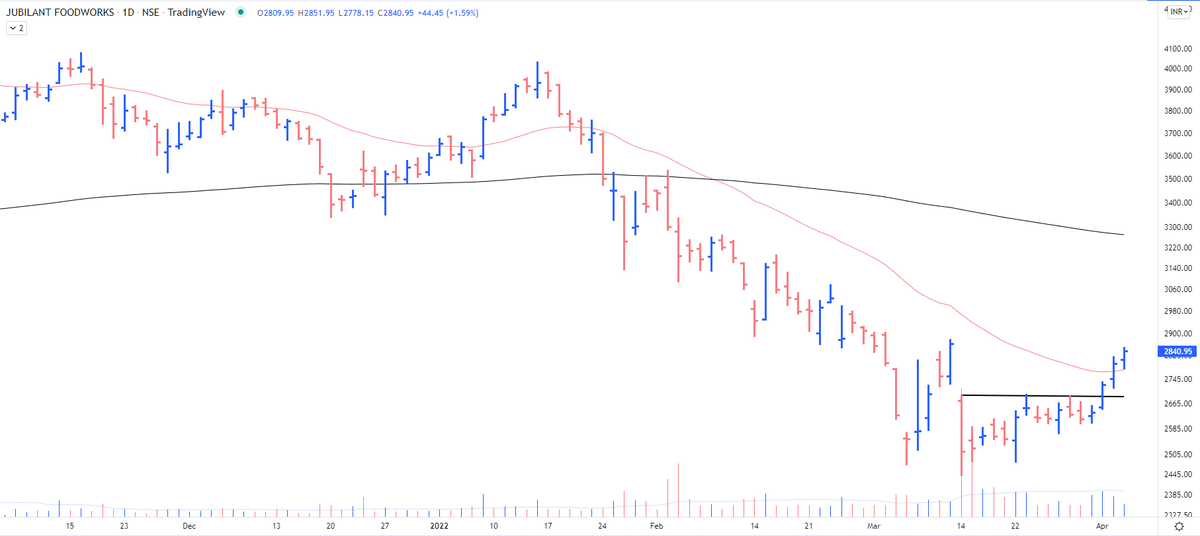
The selling climax is accompanied by volume bars of such magnitude that I highlighted in the chart. In almost all cases, they signify that even the last bull has thrown in the towel & there is no further selling left. Will observe in this case.
— The_Chartist \U0001f4c8 (@charts_zone) March 15, 2022
Jubilant Food pic.twitter.com/j7bGSdhkRW
More from The_Chartist 📈
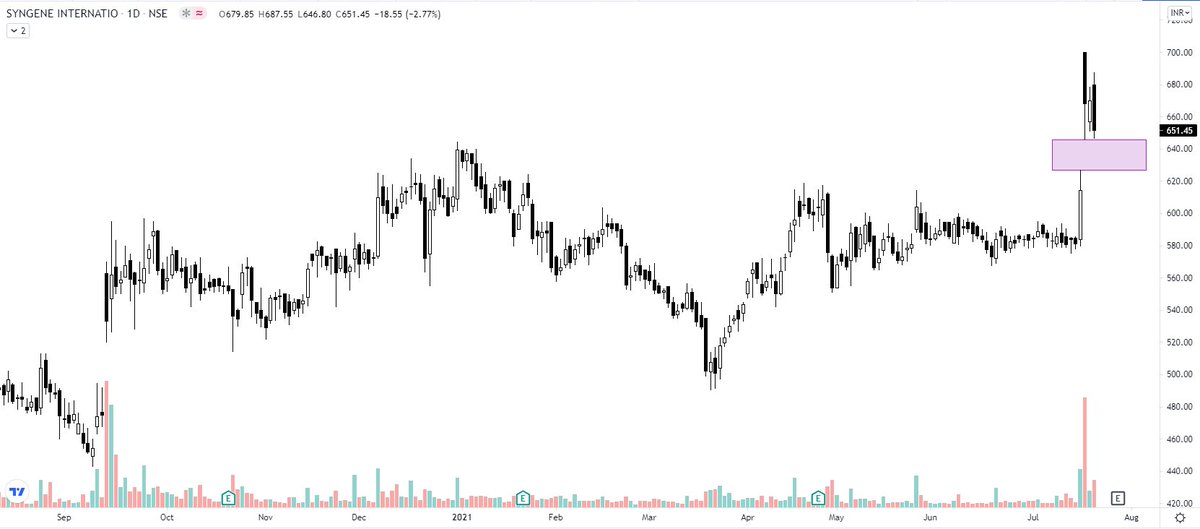

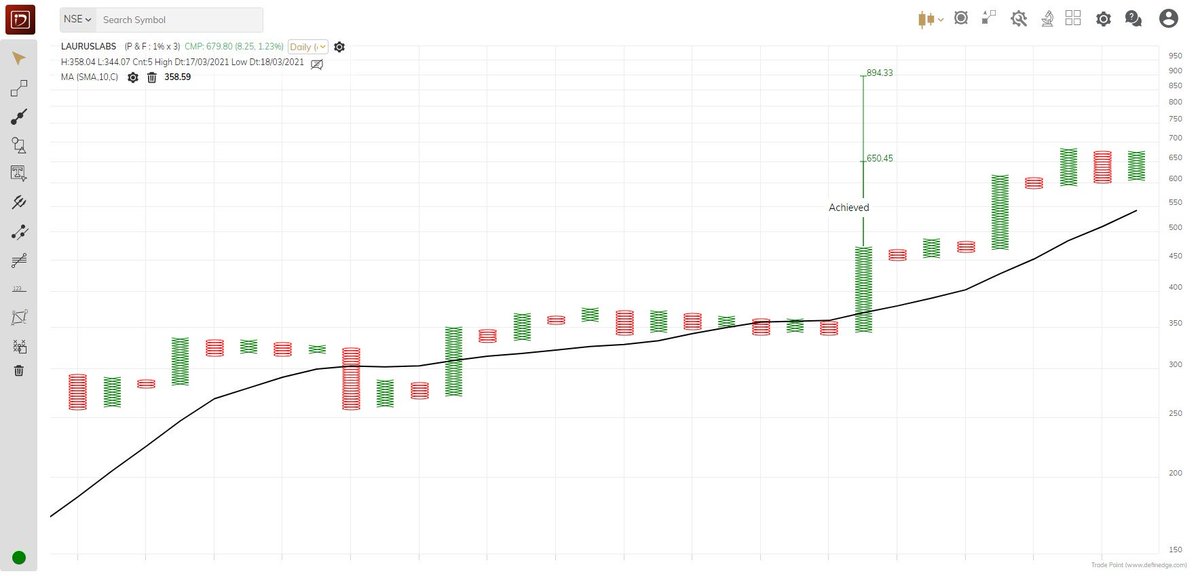
Laurus Labs - Double top buy will be activated above closing of 690. Target still active: 895 (1%*3 box size and reversal)
✅✅ https://t.co/MtJOLfpzYj
✅✅ https://t.co/MtJOLfpzYj
Laurus Labs - I am waiting till 3:15 PM to get confirmation of closing above 700 to add more of it in my portfolio. \u2705\u2705 pic.twitter.com/UxZCuxhuIX
— Steve Nison (@nison_steve) August 9, 2021