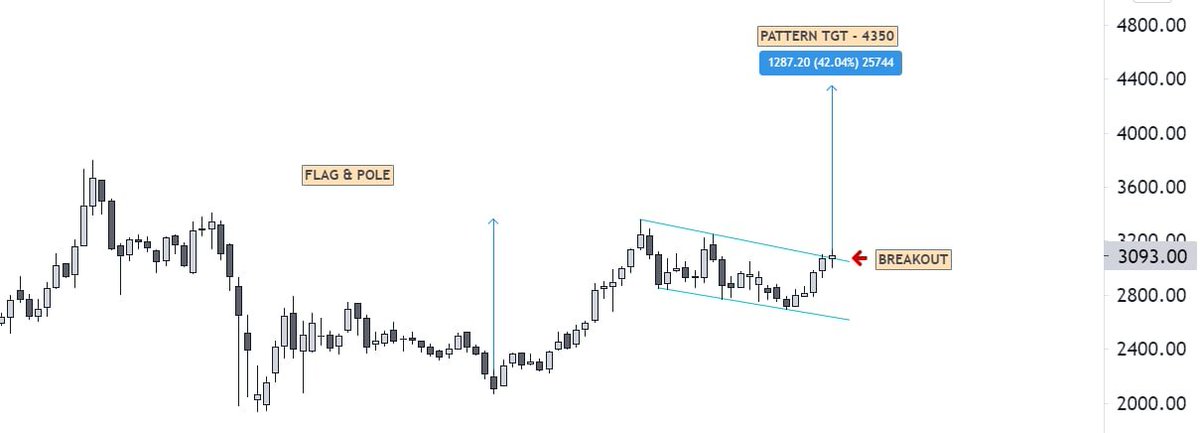
#HDFCAMC [3093]
REASONS:
1⃣ Flag&Pole BO of 6 months consolidation
2⃣ Stock is building up near 0.618 fibo level of total fall from 2020
Target - 4350
SL - 2940
@chartmojo @piyushchaudhry @SuccessIsMyJob @Abhishekkar_ @kach0289 @TechCharts @koolvicky @BissaGauravB
More from The Chartians


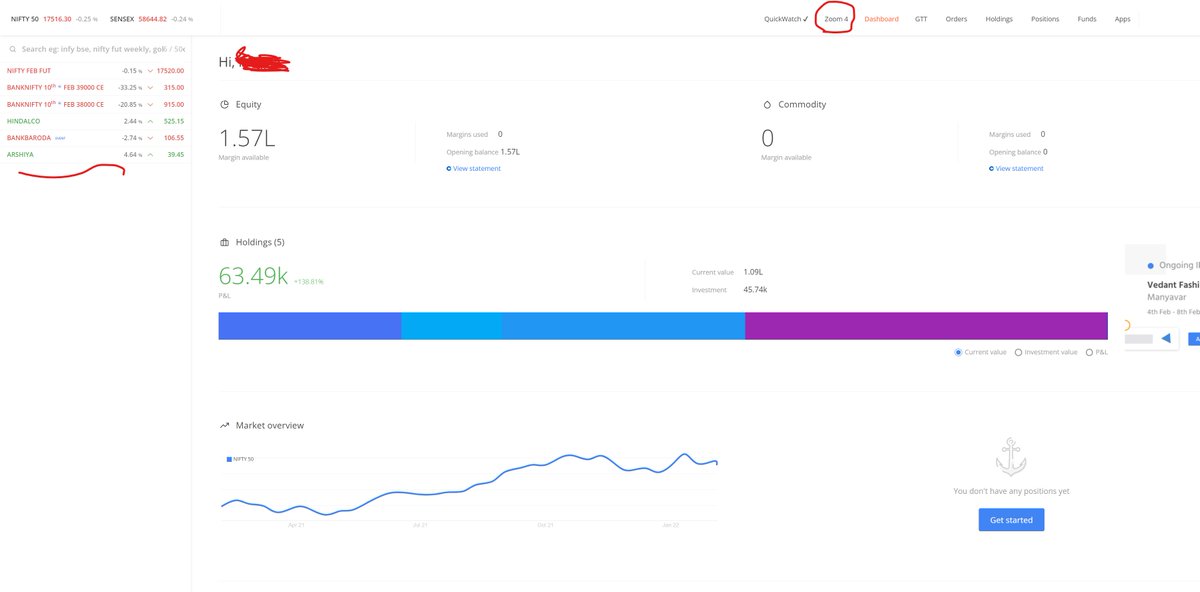
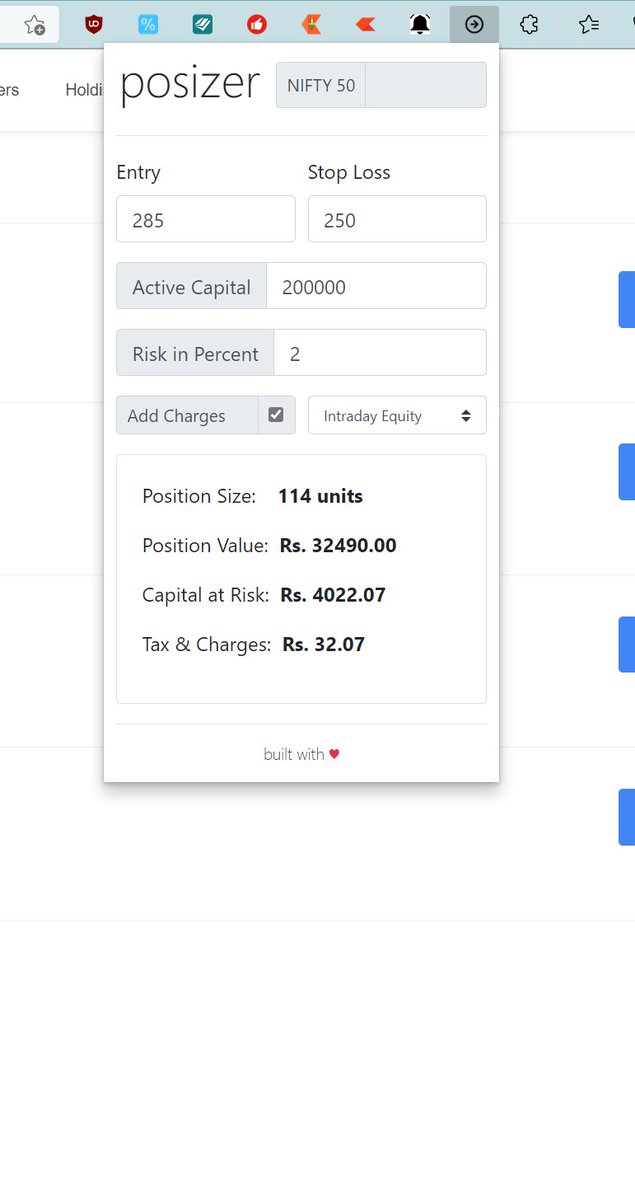
Do Share the above tweet 👆
These are going to be very simple yet effective pure price action based scanners, no fancy indicators nothing - hope you liked it.
https://t.co/JU0MJIbpRV
52 Week High
One of the classic scanners very you will get strong stocks to Bet on.
https://t.co/V69th0jwBr
Hourly Breakout
This scanner will give you short term bet breakouts like hourly or 2Hr breakout
Volume shocker
Volume spurt in a stock with massive X times
#chartkyaboltahai
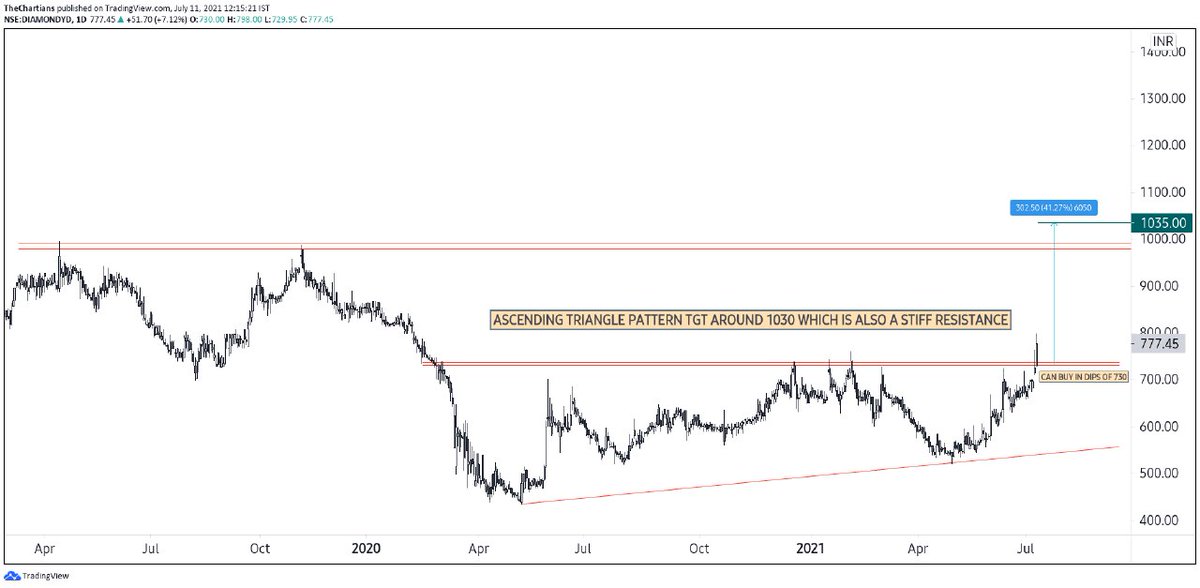
- 730 dop can be bought for tgt of 1000.
- Stock has made first HH-HL.
- Breaking previous swing low.
- Ascending traingle pattern on daily.
@ydstartupreneur
@caniravkaria bhaiji looks good on charts https://t.co/iwy4wXUiJf
#chart kya bolta hai?#kiska weekly chart hai?
— Yash Dugar (@ydstartupreneur) July 10, 2021
It is said that when weekly trend reversals are with huge volumes & strong RSI the stock becomes a good positional trade/investment.
Those who will answer it fully correctly will get access to our full report on it by @FinterestC pic.twitter.com/I4DX29TpRg
Dip*
More from Hdfcamc


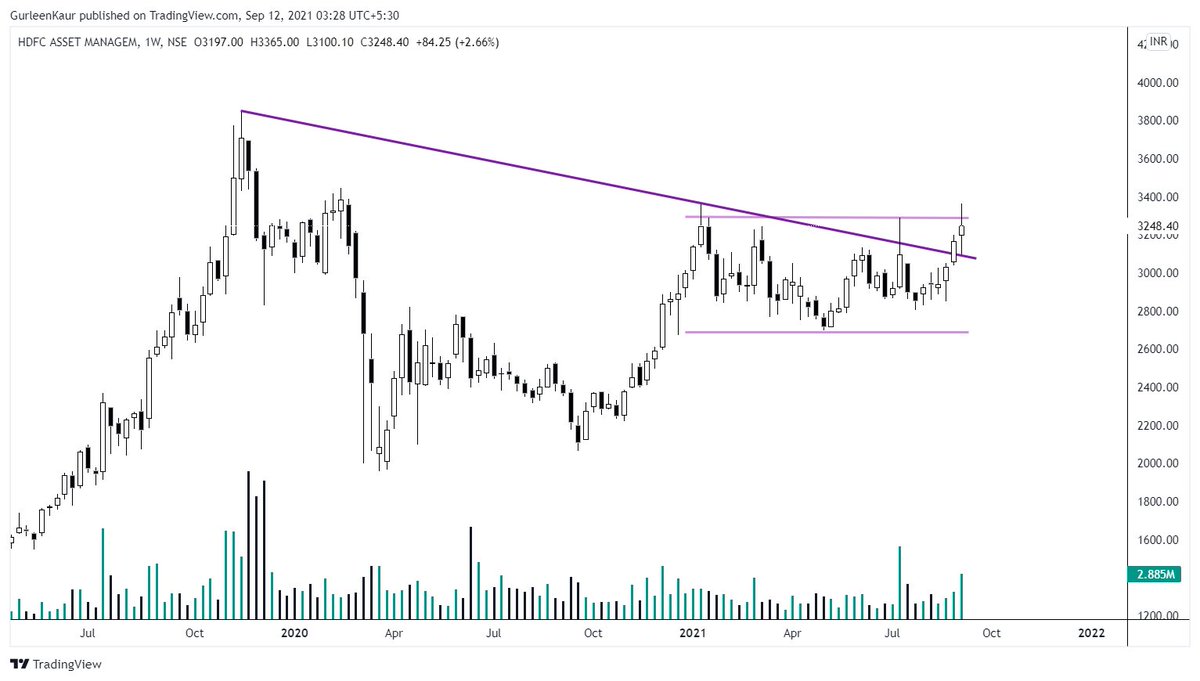
The price picked up towards crossing the horizontal level of 3290 but couldn't hold up.
Got rejected from the wick at 3365; Now the range of 3290-3365 must be broken to head higher towards 3500+
If it fails to do so; We might just see range-based action.
#StockMarket https://t.co/aRKvpy5Eyl
#HDFCAMC
— Gurleen (@GurleenKaur_19) September 6, 2021
Broken past the negative slope of lower highs. Observing the price structure, even the volumes have started picking up and are an increasing pace.
Going further; The script looks good for heading higher. #StockMarket #StocksInFocus pic.twitter.com/OiVwXGh9ee




You May Also Like


Decoded his way of analysis/logics for everyone to easily understand.
Have covered:
1. Analysis of volatility, how to foresee/signs.
2. Workbook
3. When to sell options
4. Diff category of days
5. How movement of option prices tell us what will happen
1. Keeps following volatility super closely.
Makes 7-8 different strategies to give him a sense of what's going on.
Whichever gives highest profit he trades in.
I am quite different from your style. I follow the market's volatility very closely. I have mock positions in 7-8 different strategies which allows me to stay connected. Whichever gives best profit is usually the one i trade in.
— Sarang Sood (@SarangSood) August 13, 2019
2. Theta falls when market moves.
Falls where market is headed towards not on our original position.
Anilji most of the time these days Theta only falls when market moves. So the Theta actually falls where market has moved to, not where our position was in the first place. By shifting we can come close to capturing the Theta fall but not always.
— Sarang Sood (@SarangSood) June 24, 2019
3. If you're an options seller then sell only when volatility is dropping, there is a high probability of you making the right trade and getting profit as a result
He believes in a market operator, if market mover sells volatility Sarang Sir joins him.
This week has been great so far. The main aim is to be in the right side of the volatility, rest the market will reward.
— Sarang Sood (@SarangSood) July 3, 2019
4. Theta decay vs Fall in vega
Sell when Vega is falling rather than for theta decay. You won't be trapped and higher probability of making profit.
There is a difference between theta decay & fall in vega. Decay is certain but there is no guaranteed profit as delta moves can increase cost. Fall in vega on the other hand is backed by a powerful force that sells options and gives handsome returns. Our job is to identify them.
— Sarang Sood (@SarangSood) February 12, 2020