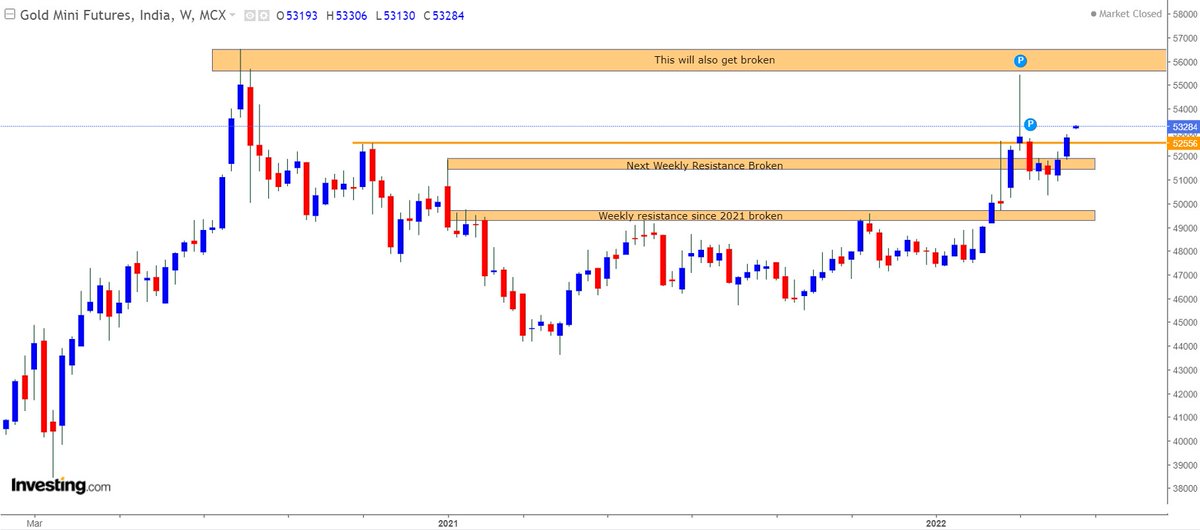
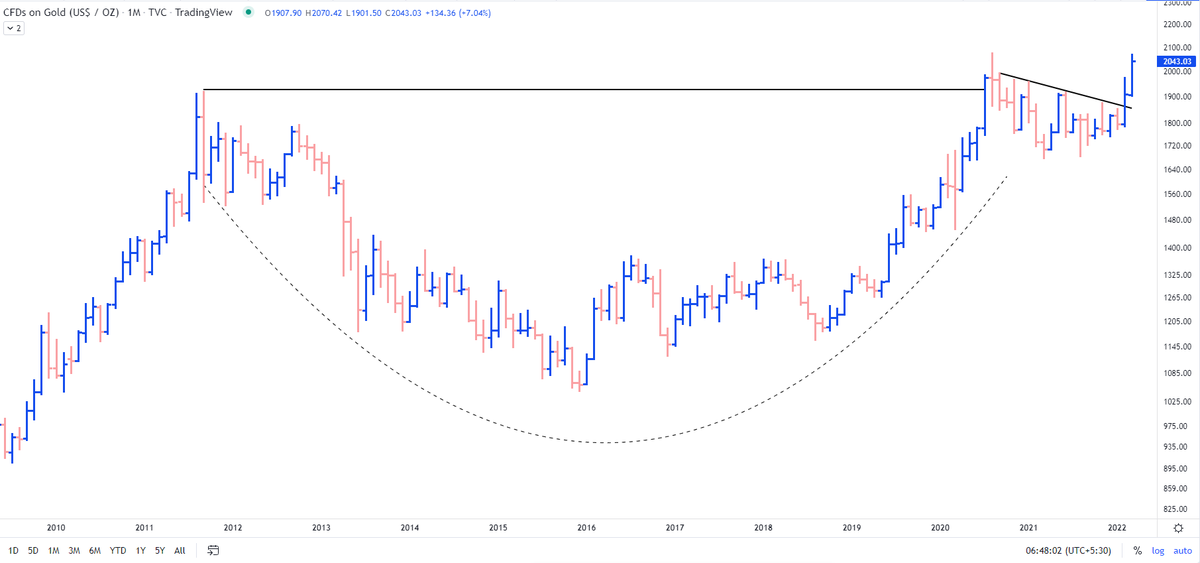
Gold looks set to head to New Highs.
$GC_F

More from Piyush Chaudhry
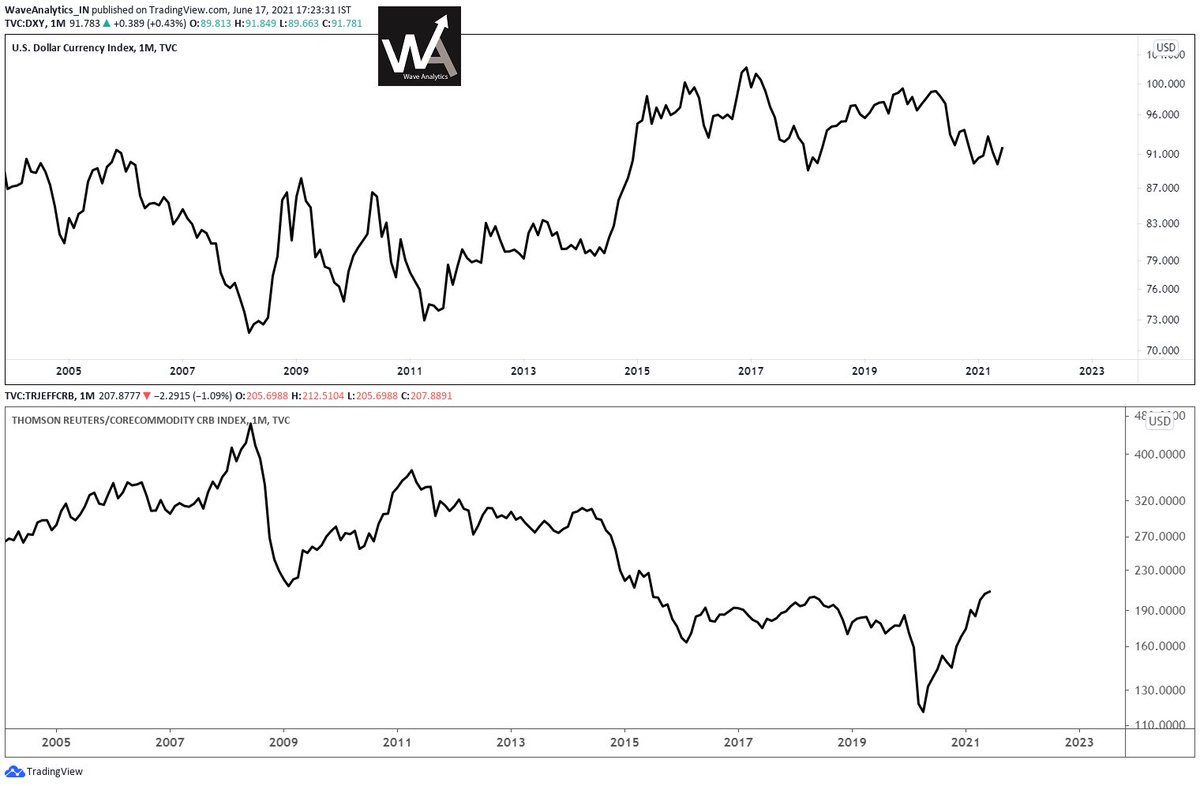
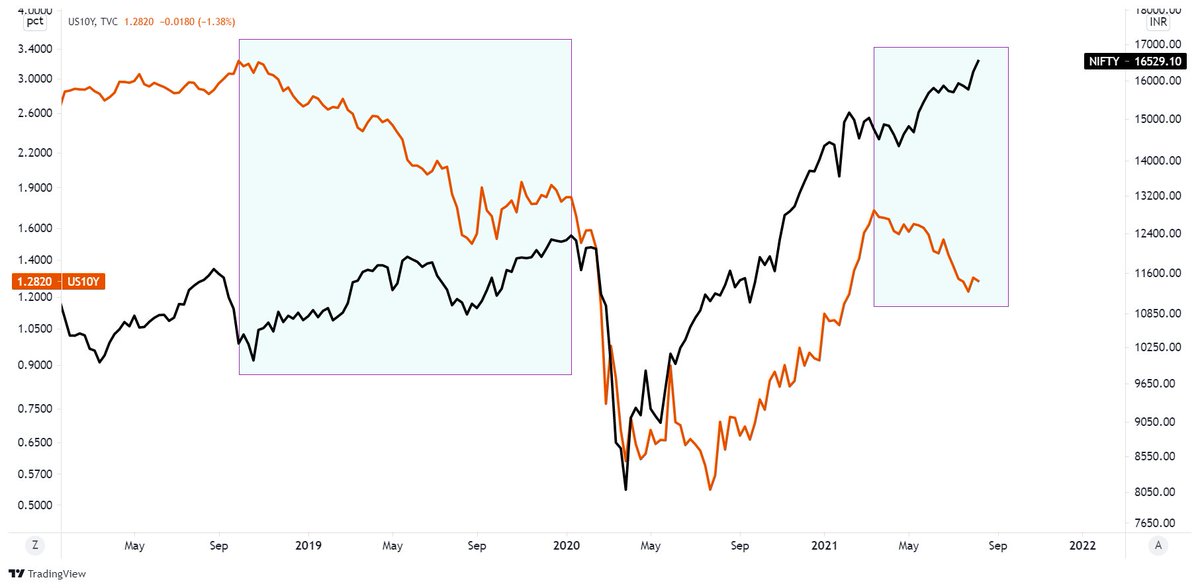
15 Months to this post. No change in the larger projections.
Long Term Chart of the Year.#NIFTY - Wave 5 (Cycle Degree) Target Zone of 25000-34000 by 2024-2027.
— Piyush Chaudhry (@piyushchaudhry) December 19, 2020
Reassessment on a breach below Blue Trendline. A breach is not a necessary invalidation. Depends on internals.
The dashed path is for representative purpose only. #ElliottWave pic.twitter.com/1xVY4OSr5T
New All Time High.
#HINDUNILVR
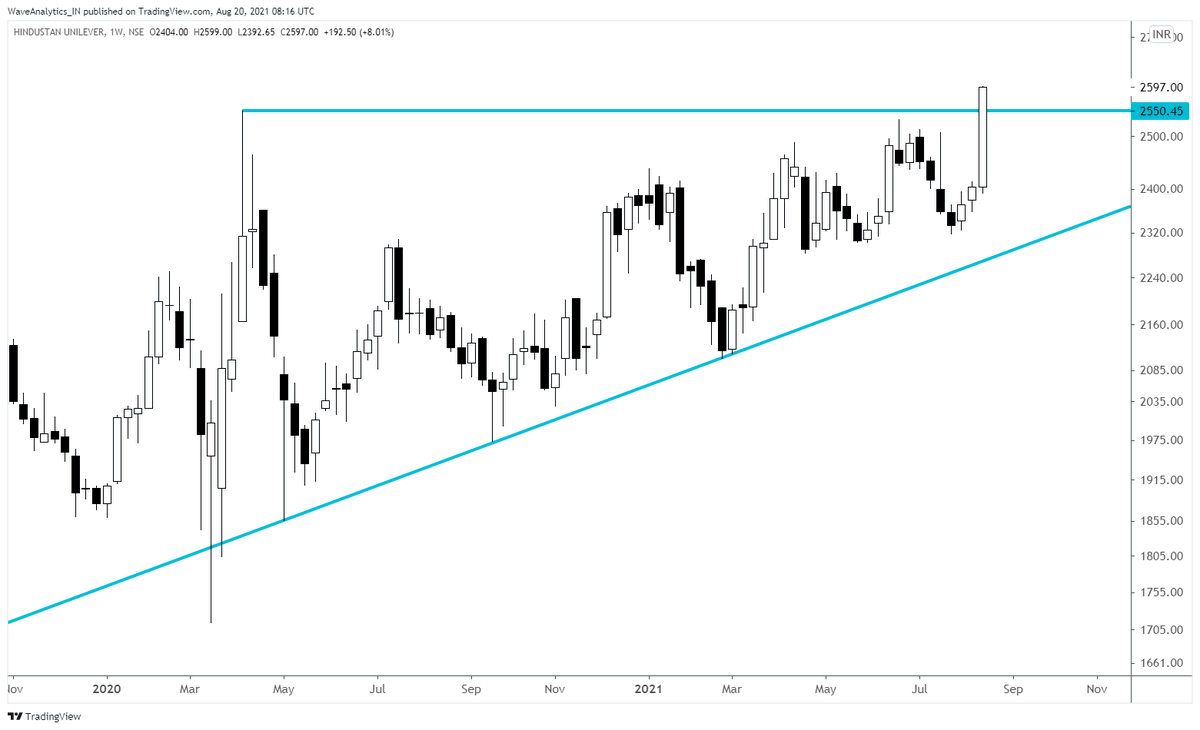
EW
Long Term Chart of the Month. #HINDUNILVR
— Piyush Chaudhry (@piyushchaudhry) December 9, 2020
Sometime in the next decade I see a fair possibility of stock reaching 7000 odd.
Invalidation below Blue Trendline. #ElliottWave pic.twitter.com/uxQrzt1mbj
as per relative strength
One question that I often get is which of the two: #HINDUNILVR or #ITC would be a better Investment bet. While their individual charts are clear themselves, another approach is ratio chart. IMHO Lever should outperform ITC for several years going forward.https://t.co/3AFqm6FJ1Q pic.twitter.com/rLuIm8xyVw
— Piyush Chaudhry (@piyushchaudhry) December 30, 2020
More from Gold

Result?
1850$ to 2070$
Updated chart https://t.co/l6pEGD7r6D
Most interesting chart:
— The_Chartist \U0001f4c8 (@charts_zone) February 12, 2022
Orange line = Gold
Blue Curve = Gold/S&P 500
Previously the ratio crossed 50 days MA in Feb' 20 with Gold giving a breakout on the charts. The previous cross of 50 days MA didn't result in gold breaking out. pic.twitter.com/HRG1fvsILp