That makes NIFTY an outlier, with the philosophical question being for how long can we persist?
NIFTY & US 10 Year Yield have a high degree of positive directional correlation. Anyhow, they are diverging at the moment though the divergence can go on for a long period of time as well, last time around this divergence did not work well for NIFTY & it got pulled down.
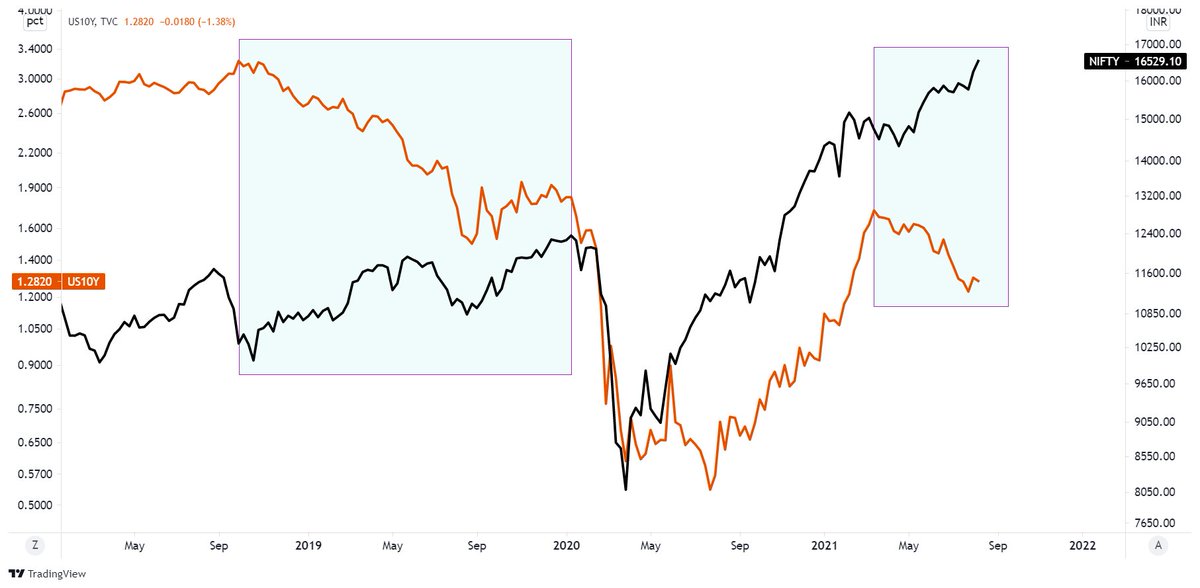
That makes NIFTY an outlier, with the philosophical question being for how long can we persist?
More from Piyush Chaudhry


More from Nifty

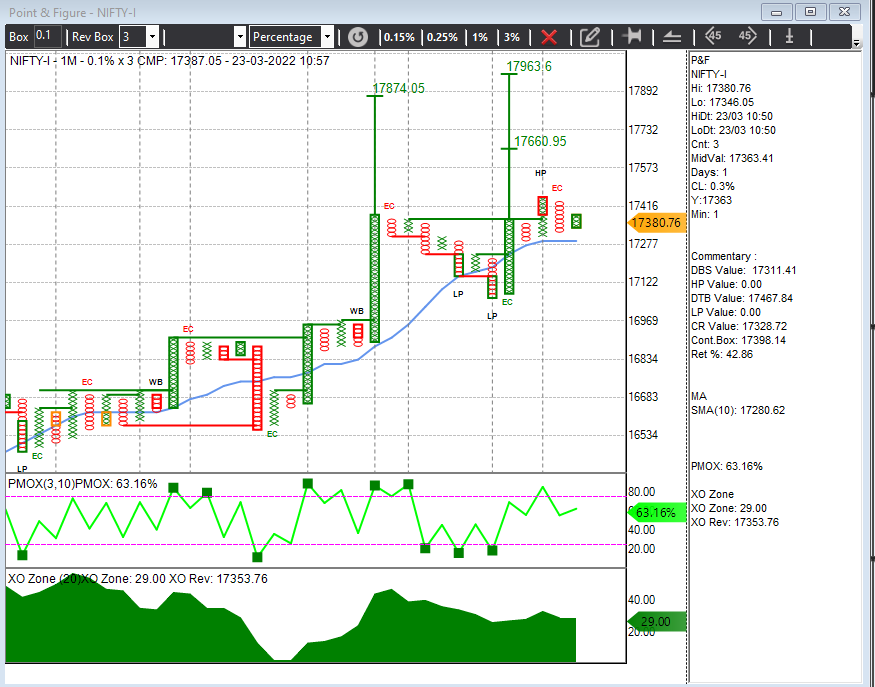


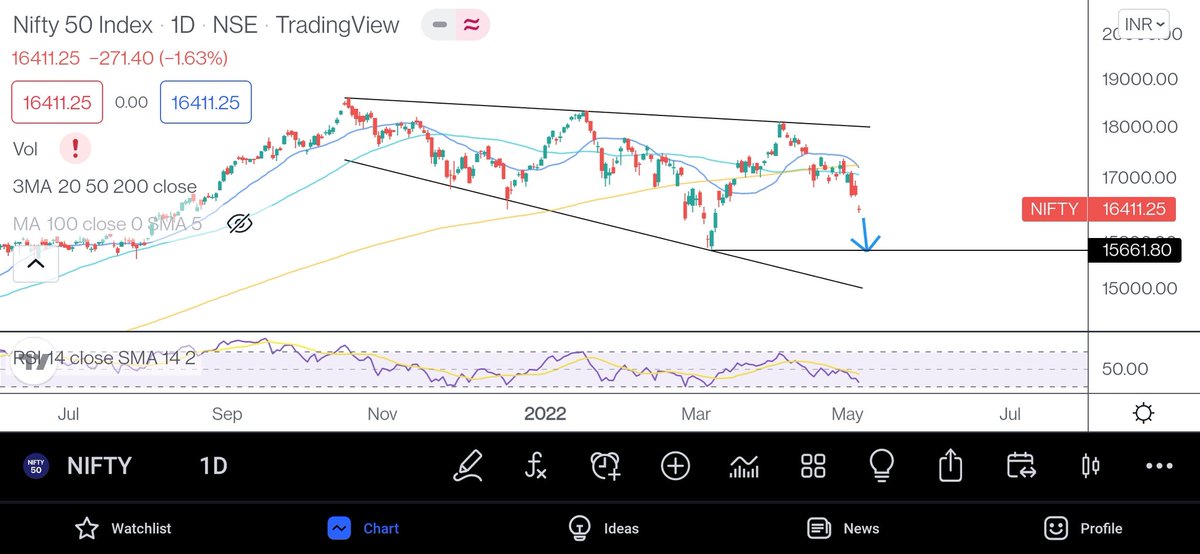
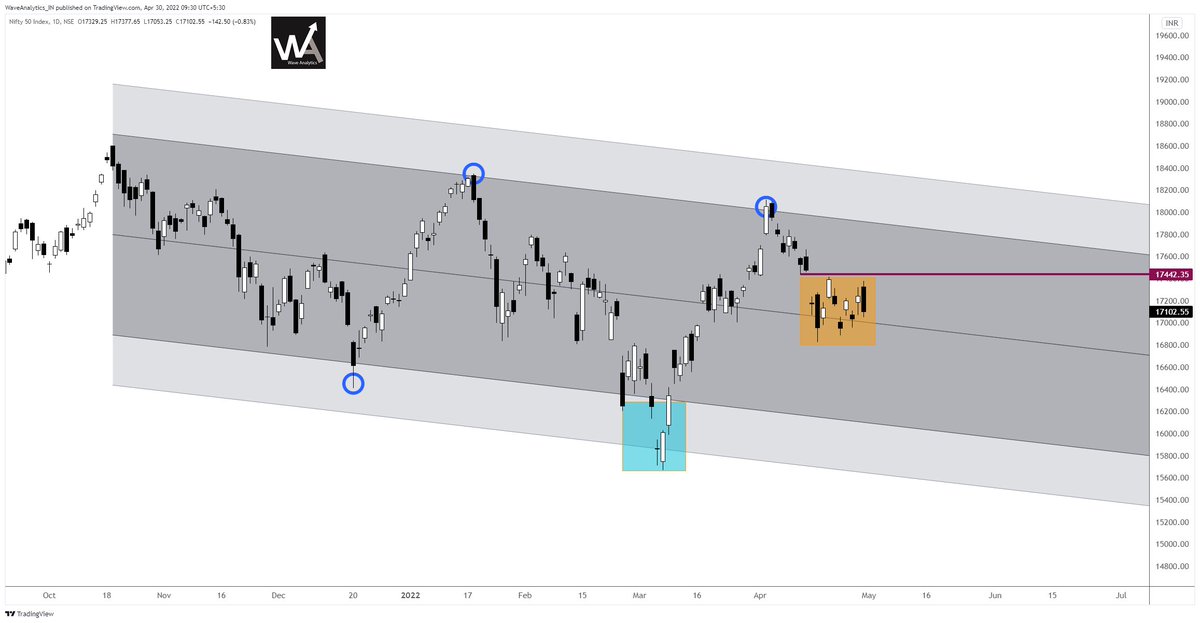
#Nifty -- Going good so far forming triangle as expected.
Till it breakouts expect pendulum swings within this structure.
I am positive for 19300-20000 above 18350.
Bottoms 16800-17000 in place and 200dema at 16600. Dont see any big cut. @moneyworks4u_fa https://t.co/lceGFlDyRM
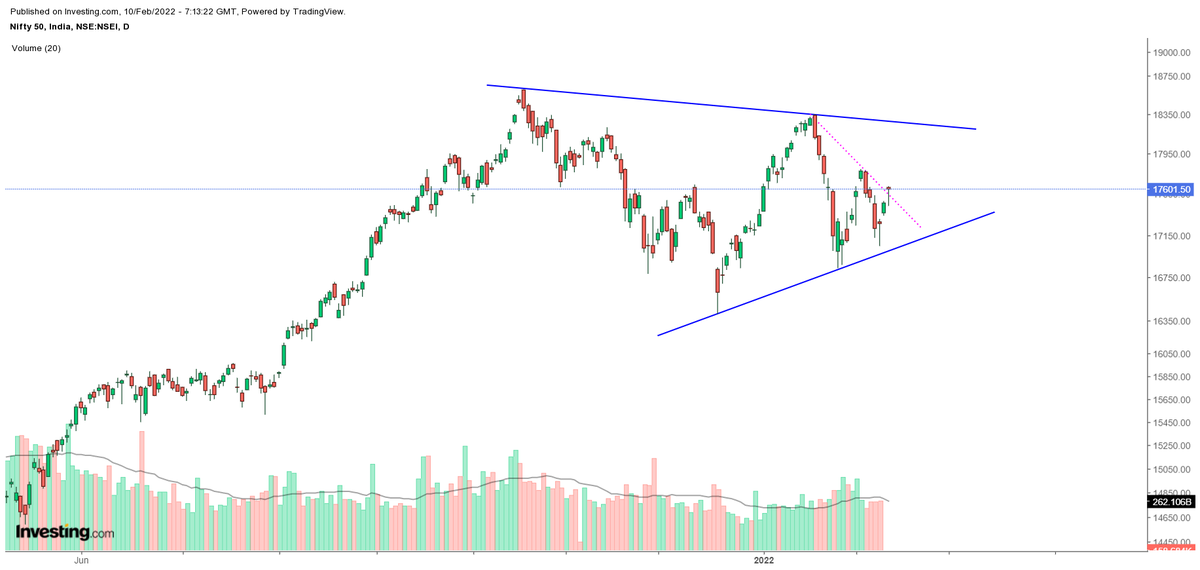
Till it breakouts expect pendulum swings within this structure.
I am positive for 19300-20000 above 18350.
Bottoms 16800-17000 in place and 200dema at 16600. Dont see any big cut. @moneyworks4u_fa https://t.co/lceGFlDyRM
#Nifty taking a shape of triangle rather than CNH.
— Shivaji Vitthalrao\U0001f1ee\U0001f1f3 (@shivaji_1983) January 29, 2022
Confirmation point is same 18350 and targets also same as below \U0001f447
Traingle /CNH whats in a name as long as targets and Confirmation point is same. https://t.co/vfM1odTd94