Candlesticks are amazing.
One Doji signifies indecision.
Two Dojis are double the amount of indecisiveness.
However, Three Dojis are very very Decisive. #TriStar
More from Piyush Chaudhry
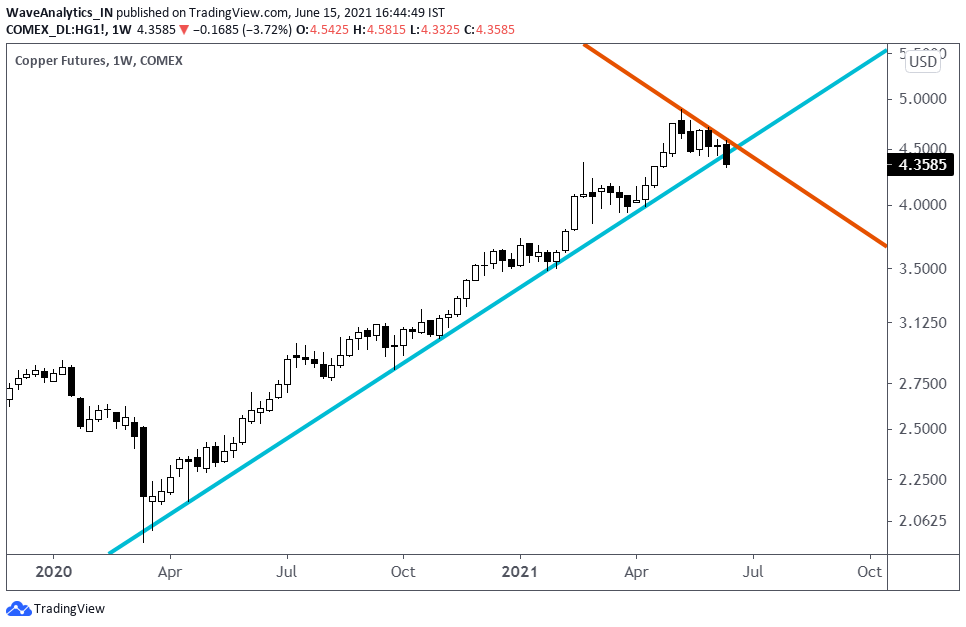
Copper breaching the rising Trendline.
Weekly Candles, so we still need to wait.
Earlier two tweets on Copper:
1. Copper - EM:
https://t.co/WogWRMIMHH
and,
2. Copper - Gold
https://t.co/Cq2zcn4bi3
Weekly Candles, so we still need to wait.
Earlier two tweets on Copper:
1. Copper - EM:
https://t.co/WogWRMIMHH
and,
2. Copper - Gold
https://t.co/Cq2zcn4bi3
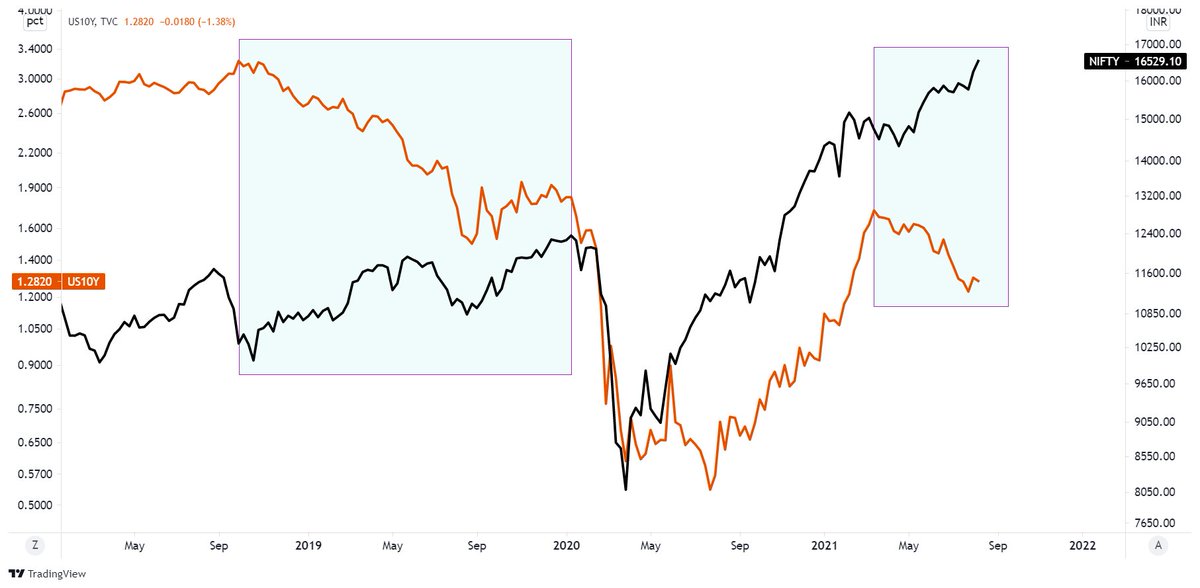
Amazingly super positive correlation between Emerging Markets and Copper.
— Piyush Chaudhry (@piyushchaudhry) June 2, 2021
*MSCI Emerging Markets ETF #EEM
*Copper Futures #Comex pic.twitter.com/rVAwfqvqD4
More from Screeners





You May Also Like

1/Politics thread time.
To me, the most important aspect of the 2018 midterms wasn't even about partisan control, but about democracy and voting rights. That's the real battle.
2/The good news: It's now an issue that everyone's talking about, and that everyone cares about.
3/More good news: Florida's proposition to give felons voting rights won. But it didn't just win - it won with substantial support from Republican voters.
That suggests there is still SOME grassroots support for democracy that transcends
4/Yet more good news: Michigan made it easier to vote. Again, by plebiscite, showing broad support for voting rights as an
5/OK, now the bad news.
We seem to have accepted electoral dysfunction in Florida as a permanent thing. The 2000 election has never really
To me, the most important aspect of the 2018 midterms wasn't even about partisan control, but about democracy and voting rights. That's the real battle.
2/The good news: It's now an issue that everyone's talking about, and that everyone cares about.
3/More good news: Florida's proposition to give felons voting rights won. But it didn't just win - it won with substantial support from Republican voters.
That suggests there is still SOME grassroots support for democracy that transcends
4/Yet more good news: Michigan made it easier to vote. Again, by plebiscite, showing broad support for voting rights as an
5/OK, now the bad news.
We seem to have accepted electoral dysfunction in Florida as a permanent thing. The 2000 election has never really
Bad ballot design led to a lot of undervotes for Bill Nelson in Broward Co., possibly even enough to cost him his Senate seat. They do appear to be real undervotes, though, instead of tabulation errors. He doesn't really seem to have a path to victory. https://t.co/utUhY2KTaR
— Nate Silver (@NateSilver538) November 16, 2018


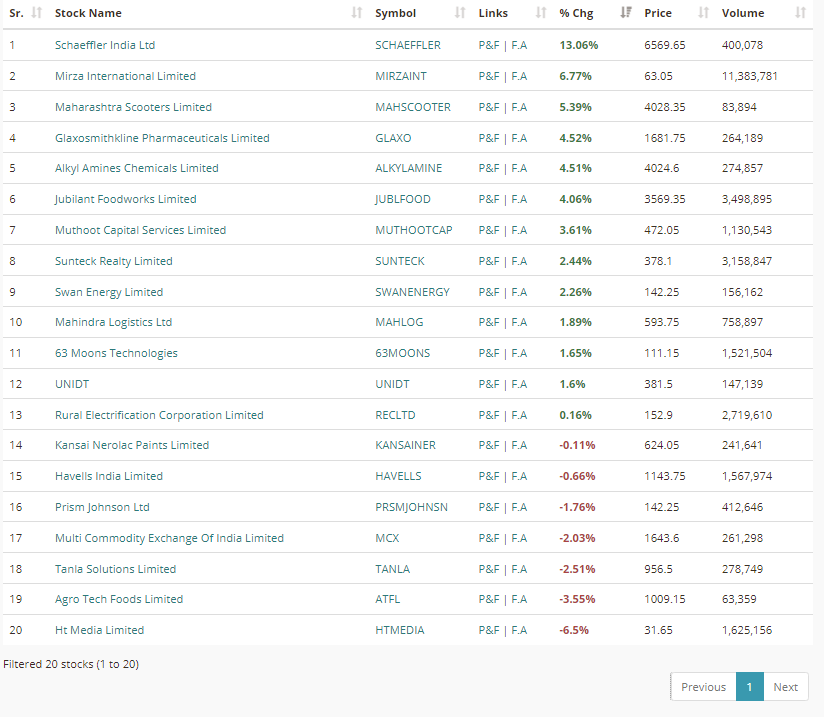
Trading view scanner process -
1 - open trading view in your browser and select stock scanner in left corner down side .
2 - touch the percentage% gain change ( and u can see higest gainer of today)
3. Then, start with 6% gainer to 20% gainer and look charts of everyone in daily Timeframe . (For fno selection u can choose 1% to 4% )
4. Then manually select the stocks which are going to give all time high BO or 52 high BO or already given.
5. U can also select those stocks which are going to give range breakout or already given range BO
6 . If in 15 min chart📊 any stock sustaing near BO zone or after BO then select it on your watchlist
7 . Now next day if any stock show momentum u can take trade in it with RM
This looks very easy & simple but,
U will amazed to see it's result if you follow proper risk management.
I did 4x my capital by trading in only momentum stocks.
I will keep sharing such learning thread 🧵 for you 🙏💞🙏
Keep learning / keep sharing 🙏
@AdityaTodmal
1 - open trading view in your browser and select stock scanner in left corner down side .
2 - touch the percentage% gain change ( and u can see higest gainer of today)
Making thread \U0001f9f5 on trading view scanner by which you can select intraday and btst stocks .
— Vikrant (@Trading0secrets) October 22, 2021
In just few hours (Without any watchlist)
Some manual efforts u have to put on it.
Soon going to share the process with u whenever it will be ready .
"How's the josh?"guys \U0001f57a\U0001f3b7\U0001f483
3. Then, start with 6% gainer to 20% gainer and look charts of everyone in daily Timeframe . (For fno selection u can choose 1% to 4% )
4. Then manually select the stocks which are going to give all time high BO or 52 high BO or already given.
5. U can also select those stocks which are going to give range breakout or already given range BO
6 . If in 15 min chart📊 any stock sustaing near BO zone or after BO then select it on your watchlist
7 . Now next day if any stock show momentum u can take trade in it with RM
This looks very easy & simple but,
U will amazed to see it's result if you follow proper risk management.
I did 4x my capital by trading in only momentum stocks.
I will keep sharing such learning thread 🧵 for you 🙏💞🙏
Keep learning / keep sharing 🙏
@AdityaTodmal