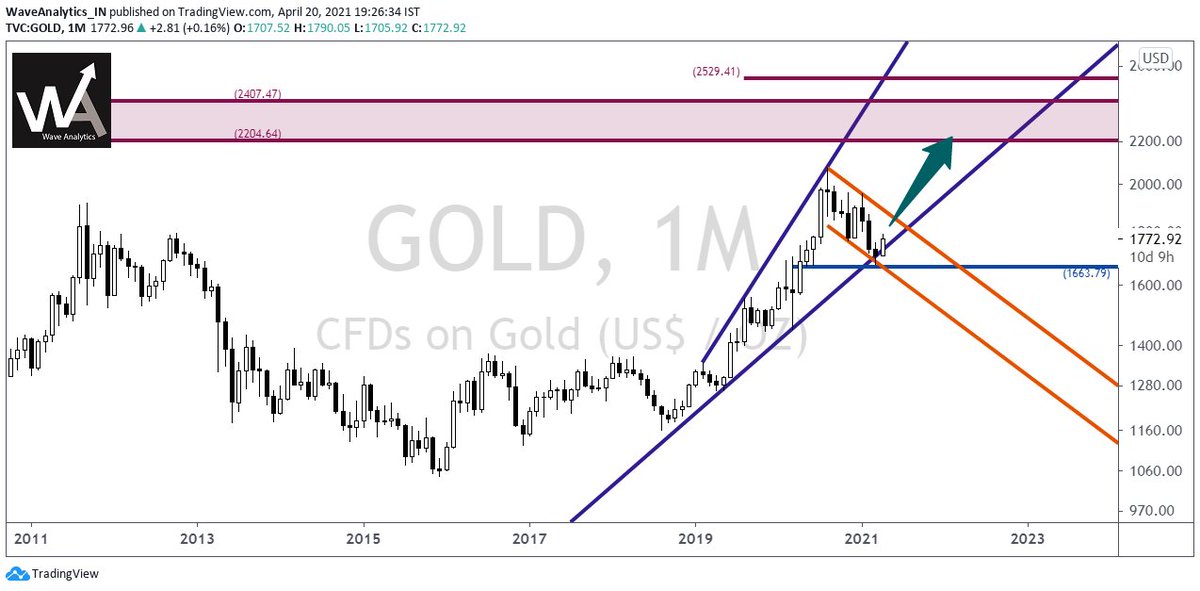
Gold Update https://t.co/RzHJLtKMmR
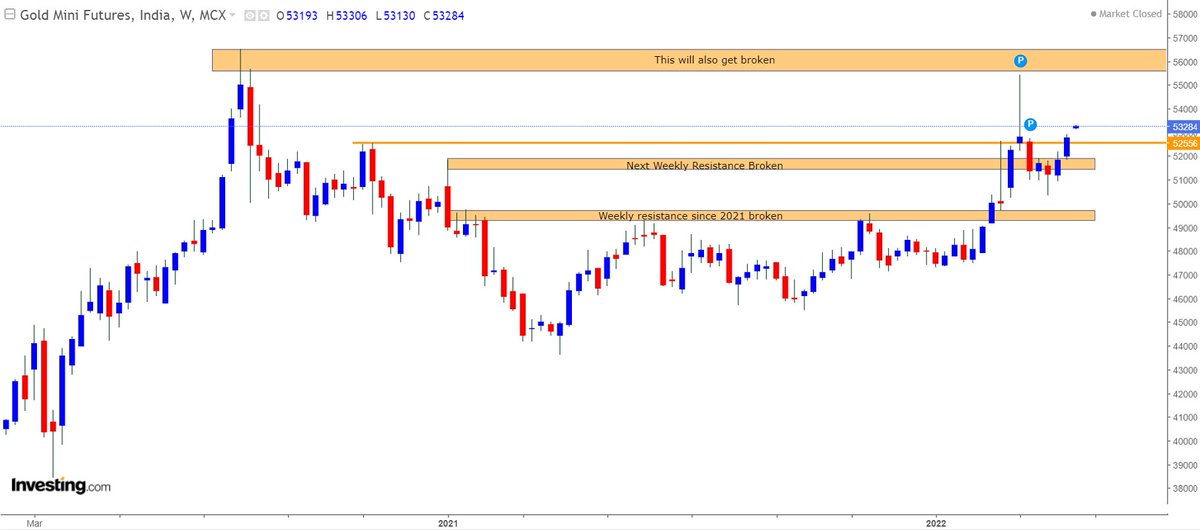
Gold again trying to clear the immediate resistance zone ! Retouch of ATH and making new high is pending....... pic.twitter.com/PLmPoB7EUO
— Professor (@DillikiBiili) April 12, 2022
More from Professor
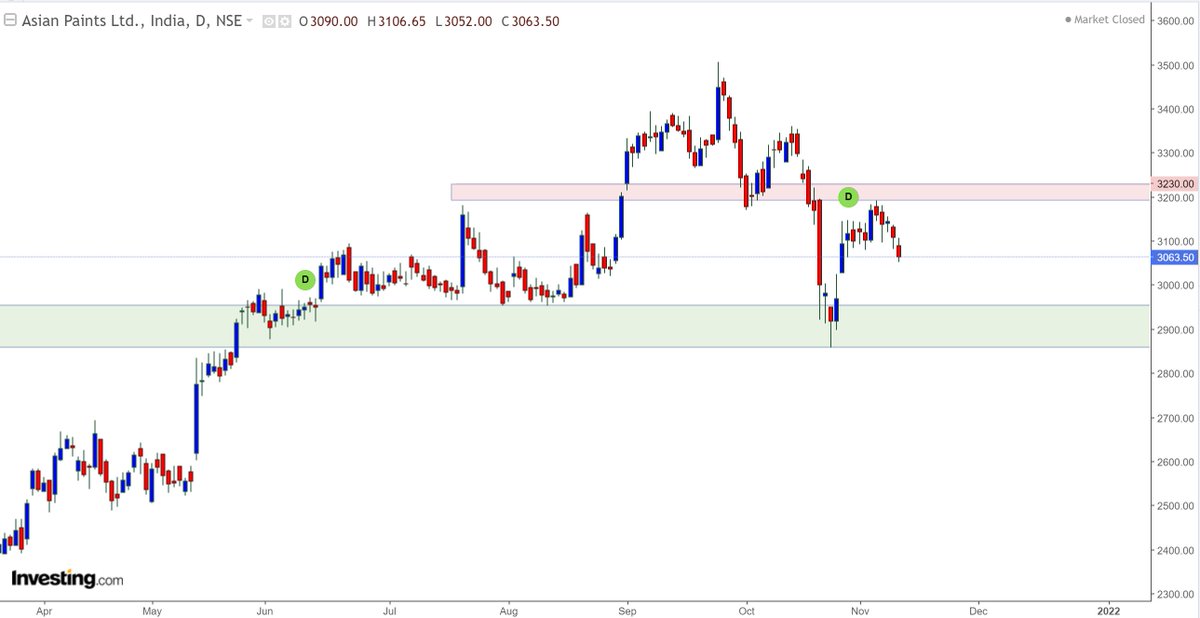
Asian Paints took a bounce exactly from the level given on 21st October.
It has string resistance at 3200, so fresh up-move will be confirmed only when it opens above 3220-3230 levels
#ASIANPAINT
#DKBPositional https://t.co/Q6fTbK5VHM
It has string resistance at 3200, so fresh up-move will be confirmed only when it opens above 3220-3230 levels
#ASIANPAINT
#DKBPositional https://t.co/Q6fTbK5VHM
Asian Paints also at crucial support line, bulls desperately need a reversal here, else it'll go in hibernation..... pic.twitter.com/VTfaMfpHXs
— Professor (@DillikiBiili) October 21, 2021