Categories Equity
7 days
30 days
All time
Recent
Popular


Trading view scanner process -
1 - open trading view in your browser and select stock scanner in left corner down side .
2 - touch the percentage% gain change ( and u can see higest gainer of today)
3. Then, start with 6% gainer to 20% gainer and look charts of everyone in daily Timeframe . (For fno selection u can choose 1% to 4% )
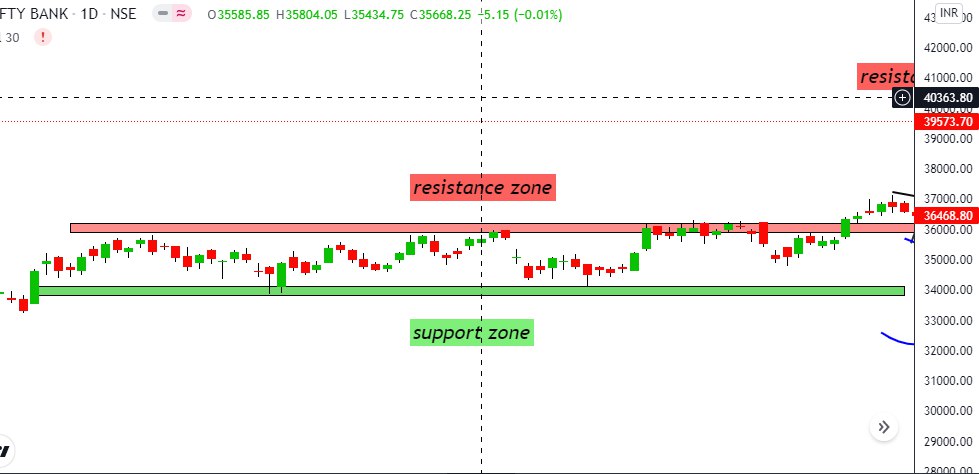
4. Then manually select the stocks which are going to give all time high BO or 52 high BO or already given.
5. U can also select those stocks which are going to give range breakout or already given range BO
6 . If in 15 min chart📊 any stock sustaing near BO zone or after BO then select it on your watchlist
7 . Now next day if any stock show momentum u can take trade in it with RM
This looks very easy & simple but,
U will amazed to see it's result if you follow proper risk management.
I did 4x my capital by trading in only momentum stocks.
I will keep sharing such learning thread 🧵 for you 🙏💞🙏
Keep learning / keep sharing 🙏
@AdityaTodmal
1 - open trading view in your browser and select stock scanner in left corner down side .
2 - touch the percentage% gain change ( and u can see higest gainer of today)
Making thread \U0001f9f5 on trading view scanner by which you can select intraday and btst stocks .
— Vikrant (@Trading0secrets) October 22, 2021
In just few hours (Without any watchlist)
Some manual efforts u have to put on it.
Soon going to share the process with u whenever it will be ready .
"How's the josh?"guys \U0001f57a\U0001f3b7\U0001f483
3. Then, start with 6% gainer to 20% gainer and look charts of everyone in daily Timeframe . (For fno selection u can choose 1% to 4% )
4. Then manually select the stocks which are going to give all time high BO or 52 high BO or already given.
5. U can also select those stocks which are going to give range breakout or already given range BO
6 . If in 15 min chart📊 any stock sustaing near BO zone or after BO then select it on your watchlist
7 . Now next day if any stock show momentum u can take trade in it with RM
This looks very easy & simple but,
U will amazed to see it's result if you follow proper risk management.
I did 4x my capital by trading in only momentum stocks.
I will keep sharing such learning thread 🧵 for you 🙏💞🙏
Keep learning / keep sharing 🙏
@AdityaTodmal