๐“๐ก๐ž ๐Ÿ“๐Ÿ-๐–๐ž๐ž๐ค ๐ˆ๐ง๐๐ž๐ฑ ๐’๐œ๐š๐ง๐ง๐ž๐ซ ๐Ÿ“Š

A THREAD ๐Ÿงต

Please Like & RT this if you find value ๐Ÿ™

The 52-week index filter on @screener_in is one of the most effective ways to filter out stocks for #equity segment.

Here's how it can help you ๐Ÿ‘‡

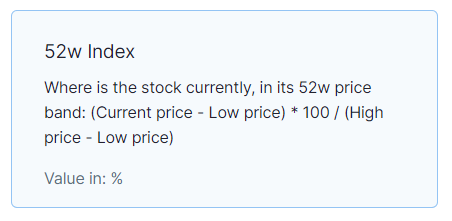
1/ The 52-week index is simply a stock in its 52-week band.
The formula is:
(๐˜Š๐˜ถ๐˜ณ๐˜ณ๐˜ฆ๐˜ฏ๐˜ต ๐˜ฑ๐˜ณ๐˜ช๐˜ค๐˜ฆ - ๐˜“๐˜ฐ๐˜ธ ๐˜ฑ๐˜ณ๐˜ช๐˜ค๐˜ฆ) * 100 / (๐˜๐˜ช๐˜จ๐˜ฉ ๐˜ฑ๐˜ณ๐˜ช๐˜ค๐˜ฆ - ๐˜“๐˜ฐ๐˜ธ ๐˜ฑ๐˜ณ๐˜ช๐˜ค๐˜ฆ)
๐—ฉ๐—ฎ๐—น๐˜‚๐—ฒ ๐—ถ๐—ป %
2/ Now you may ask what is the ๐Ÿฑ๐Ÿฎ-๐˜„๐—ฒ๐—ฒ๐—ธ ๐—ฏ๐—ฎ๐—ป๐—ฑ?
Lets understand this with an example -
Take this example of #Birlasoft.
Current Price= โ‚น531
52-Week High= โ‚น538
52-Low= โ‚น216

So, its ๐Ÿฑ๐Ÿฎ-๐˜„๐—ฒ๐—ฒ๐—ธ ๐—ฏ๐—ฎ๐—ป๐—ฑ comes at -
= (531-216)/(538-216)*100
= 97.5%
3/ What does this mean?

Basically, we want to look at stocks that are in the top half of their 52-week band (the highlighted area in the diagram) or within 75% of its ๐Ÿฑ๐Ÿฎ-๐˜„๐—ฒ๐—ฒ๐—ธ ๐—ฏ๐—ฎ๐—ป๐—ฑ.
4/ The main reason we want to select these stocks are because we want stocks wherein the demand is more than its supply.

A stock within its 52-week band means that buyers are still activated here. This simply shortens our filtering process.
5/ Link for a #Scanner I use on weekends on @screener_in -
https://t.co/MVIlKkVfF3
6/ This isn't perfect but it gives you with around 200 names during the weekend, you have to go through them manually and trade stocks that are outperforming the broader #NIFTY500 and breaking out of sound technical structures.
7/ The best thing about this is that it gives us stocks to trade that are structurally quite good (HH-HL).

แด›สœแด€ษดแด‹ สแดแดœ!โ™ฅ๏ธ

๐‘๐ž๐ญ๐ฐ๐ž๐ž๐ญ ๐ญ๐ก๐ž ๐Ÿ๐ข๐ซ๐ฌ๐ญ ๐ญ๐ฐ๐ž๐ž๐ญ ๐ข๐ง ๐ญ๐ก๐ข๐ฌ ๐ญ๐ก๐ซ๐ž๐š๐ ๐Ÿ๐จ๐ซ ๐›๐ž๐ญ๐ญ๐ž๐ซ ๐ซ๐ž๐š๐œ๐ก. โœŠ

More from Equity

Trading view scanner process -

1 - open trading view in your browser and select stock scanner in left corner down side .

2 - touch the percentage% gain change ( and u can see higest gainer of today)


3. Then, start with 6% gainer to 20% gainer and look charts of everyone in daily Timeframe . (For fno selection u can choose 1% to 4% )

4. Then manually select the stocks which are going to give all time high BO or 52 high BO or already given.

5. U can also select those stocks which are going to give range breakout or already given range BO

6 . If in 15 min chart๐Ÿ“Š any stock sustaing near BO zone or after BO then select it on your watchlist

7 . Now next day if any stock show momentum u can take trade in it with RM

This looks very easy & simple but,

U will amazed to see it's result if you follow proper risk management.

I did 4x my capital by trading in only momentum stocks.

I will keep sharing such learning thread ๐Ÿงต for you ๐Ÿ™๐Ÿ’ž๐Ÿ™

Keep learning / keep sharing ๐Ÿ™
@AdityaTodmal

You May Also Like

12 TRADING SETUPS which experts are using.

These setups I found from the following 4 accounts:

1. @Pathik_Trader
2. @sourabhsiso19
3. @ITRADE191
4. @DillikiBiili

Share for the benefit of everyone.

Here are the setups from @Pathik_Trader Sir first.

1. Open Drive (Intraday Setup explained)


Bactesting results of Open Drive


2. Two Price Action setups to get good long side trade for intraday.

1. PDC Acts as Support
2. PDH Acts as


Example of PDC/PDH Setup given