https://t.co/D9Qwt9Y6zu
1. Ultimate blockchain, NFT and crypto learning thread 👇
(warning 100's of hrs of content)
https://t.co/D9Qwt9Y6zu
https://t.co/DRQwQWHVho
https://t.co/B8HfP2USOH
https://t.co/btUuUALVc8
https://t.co/ypUJxbCBRT
https://t.co/61llZyS0z5
https://t.co/4gQEOviQ5A
https://t.co/PTSoWCUYJN
https://t.co/qp161jfGve
https://t.co/5aPOxzIgne
https://t.co/P6tJZvlnHC
https://t.co/9jx6rCIQHa
More from Crypto


1/ Welcome to #DeFi Wednesday.
Let's talk about how interest-bearing cash on a blockchain is going to revolutionise boring corporate treasury management that concerns every company is is a larger business than all crypto trading in the world.
Enter the thread
👇👇👇
2/ Blockchain community is often seen as toxic maxis and redditors who shill other their weekly favourite shitcoin in the hope of getting Lambo.
Sometimes we also do things that progress humanity towards the better future and interest-bearing cash is one of those things.

3/ Less chad and more things that actually matter:
My incomplete theory of interest-bearing cash is also available also as a blog post:
https://t.co/uiG0fZiVyu
It is 15 pages. Pick your slow poison or die fast by continue reading here.
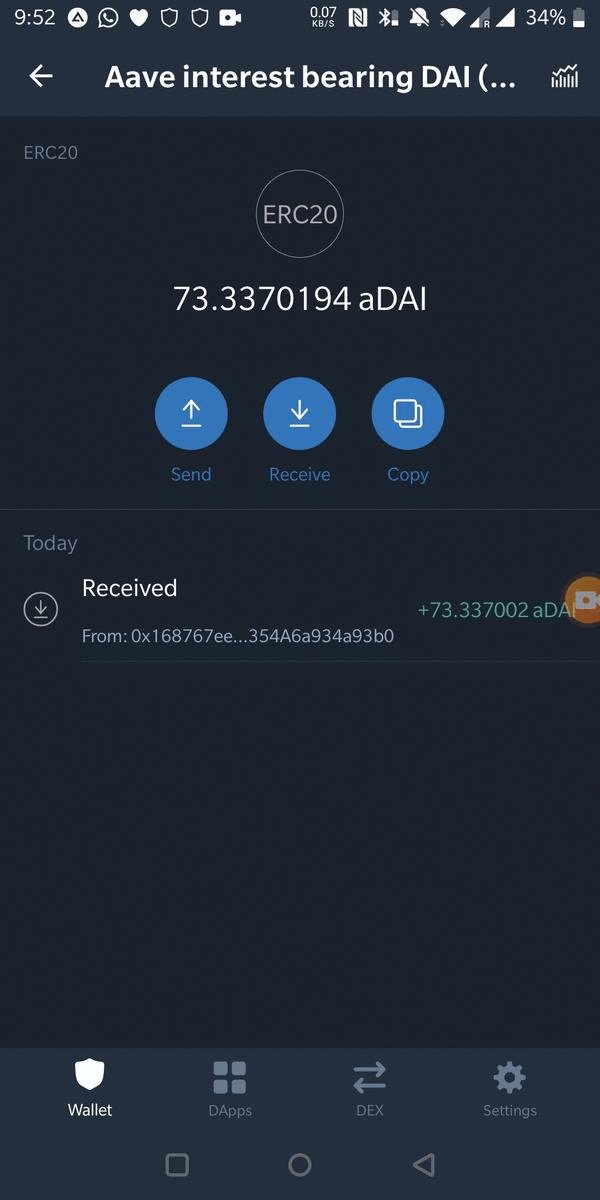
4/ First time in the history we have an ability to create interest-bearing cash-like instruments.
Interest-bearing cash ticks up dollar (euro) balance real-time in your wallet.
Here is a demonstration using @aaveaave aDAI, based on @makerdao DAI, and @TrustWalletApp
5/ Interest-bearing cash is not like your bank's saving account. Your money in a bank is not yours, but bank's. There are some flaws in the current banking system causing a headache for Chief Financial Officers (CFOs)
Let's talk about how interest-bearing cash on a blockchain is going to revolutionise boring corporate treasury management that concerns every company is is a larger business than all crypto trading in the world.
Enter the thread
👇👇👇
2/ Blockchain community is often seen as toxic maxis and redditors who shill other their weekly favourite shitcoin in the hope of getting Lambo.
Sometimes we also do things that progress humanity towards the better future and interest-bearing cash is one of those things.
3/ Less chad and more things that actually matter:
My incomplete theory of interest-bearing cash is also available also as a blog post:
https://t.co/uiG0fZiVyu
It is 15 pages. Pick your slow poison or die fast by continue reading here.
4/ First time in the history we have an ability to create interest-bearing cash-like instruments.
Interest-bearing cash ticks up dollar (euro) balance real-time in your wallet.
Here is a demonstration using @aaveaave aDAI, based on @makerdao DAI, and @TrustWalletApp
5/ Interest-bearing cash is not like your bank's saving account. Your money in a bank is not yours, but bank's. There are some flaws in the current banking system causing a headache for Chief Financial Officers (CFOs)





You may be wondering why @bristoliver rather cryptically RT’d a chart that I posted last night. The answer is not just that he loves quadratic fits on log axes, but that this chart may –and I stress may– hint at a vaccine effect amongst the over 80s THREAD
WARNING: this is a long thread, and it’s a bit of a roller-coaster. We find some apparently strong patterns in the data, and then start to unpick them a bit. So if you start getting excited half way through you might find you’re less excited at the end. But we’ll see…
First we first have to go back a bit. @bristoliver posted a thread a few days ago explaining why, with a constant vaccination rate, a log plot of cases should show a quadratic form. In other words, it should fit an equation like: a + b.x + c.x^2
I meant to link in the model thread there - here it is
the quadratic coefficient – the ‘c’ in that equation – gives an estimate of the % of the population who are being newly protected by the vaccine each day. Please note ‘protected by the vaccine’, not ‘vaccinated’ – as we don't expect 100% protection after the first dose
ok, I lied. but strictly it's not a new graph, just a new trendline (now a quadratic on the log plot). looks um... quite a good fit. so I'd say that was interesting. pic.twitter.com/qkgyMf1ya8
— James Ward (@JamesWard73) January 27, 2021
WARNING: this is a long thread, and it’s a bit of a roller-coaster. We find some apparently strong patterns in the data, and then start to unpick them a bit. So if you start getting excited half way through you might find you’re less excited at the end. But we’ll see…
First we first have to go back a bit. @bristoliver posted a thread a few days ago explaining why, with a constant vaccination rate, a log plot of cases should show a quadratic form. In other words, it should fit an equation like: a + b.x + c.x^2
I meant to link in the model thread there - here it is
Been thinking about where we are, where we might be going, what effect vaccines might have and how to tell. This thread may not happen all at once, and will get a bit mathematical in a couple of places (sorry!), but I will put in pictures. It's yet another argument for log scales
— Oliver Johnson (@BristOliver) January 24, 2021
the quadratic coefficient – the ‘c’ in that equation – gives an estimate of the % of the population who are being newly protected by the vaccine each day. Please note ‘protected by the vaccine’, not ‘vaccinated’ – as we don't expect 100% protection after the first dose

Michael Pettis @michaelxpettis argues that it is not always obvious who (China or the U.S.) adjusts best to "turbulent changes."
Bitcoin answers that question.
Thread:
World economies currently suffer four major redistribution challenges:
The most important is increasing government stealth use of the monetary system to confiscate assets from productive actors.
/2
That process is exacerbated by "Cantillon Effect" transfers to interest groups close to government ("the entitled class," public sector workers, the medical industrial complex, academia, etc....), which is destroying much of that wealth /3
The shadow nature (see Keynes) of government inflation makes the process unidentifiable, un-addressable and undemocratic.
The biggest victims (America's poorly educated young) are unequipped to counter generational confiscation tactics of today's wily senior beneficiaries. /4
Government control of the numéraire in key economic statistics (GDP, inflation, etc...) makes it impossible for economic actors to measure progress and liabilities. /5
Bitcoin answers that question.
Thread:
1/11
— Michael Pettis (@michaelxpettis) January 11, 2021
An article worth thinking about: \u201cAs changes to the world structure accelerate, China\u2019s rule is in sharp contrast with the turmoil in the West,\u201d says Beijing.
I agree, but I draw a different conclusion. The world is certainly currently going...https://t.co/ugha7ygqqx
World economies currently suffer four major redistribution challenges:
The most important is increasing government stealth use of the monetary system to confiscate assets from productive actors.
/2
That process is exacerbated by "Cantillon Effect" transfers to interest groups close to government ("the entitled class," public sector workers, the medical industrial complex, academia, etc....), which is destroying much of that wealth /3
The shadow nature (see Keynes) of government inflation makes the process unidentifiable, un-addressable and undemocratic.
The biggest victims (America's poorly educated young) are unequipped to counter generational confiscation tactics of today's wily senior beneficiaries. /4
Government control of the numéraire in key economic statistics (GDP, inflation, etc...) makes it impossible for economic actors to measure progress and liabilities. /5
You May Also Like





Took me 5 years to get the best Chartink scanners for Stock Market, but you’ll get it in 5 mminutes here ⏰
Do Share the above tweet 👆
These are going to be very simple yet effective pure price action based scanners, no fancy indicators nothing - hope you liked it.
https://t.co/JU0MJIbpRV
52 Week High
One of the classic scanners very you will get strong stocks to Bet on.
https://t.co/V69th0jwBr
Hourly Breakout
This scanner will give you short term bet breakouts like hourly or 2Hr breakout
Volume shocker
Volume spurt in a stock with massive X times
Do Share the above tweet 👆
These are going to be very simple yet effective pure price action based scanners, no fancy indicators nothing - hope you liked it.
https://t.co/JU0MJIbpRV
52 Week High
One of the classic scanners very you will get strong stocks to Bet on.
https://t.co/V69th0jwBr
Hourly Breakout
This scanner will give you short term bet breakouts like hourly or 2Hr breakout
Volume shocker
Volume spurt in a stock with massive X times