Directional Traders are good at spotting patterns.

But 98.8% of the new traders, don't know how to spot patterns.

I analyzed @niki_poojary 's account, to learn the most important patterns to master.

Here are the 8 of the most important patterns: 🧵

@niki_poojary 1/ Cup and handle Pattern

Happens during an uptrend.

The cup portion has a U-shaped appearance.

The bears are getting weaker as they are unable to drive the prices below the last low.

Subhasish Pani uses this a lot in stocks to spot bullish trades.
@niki_poojary 2/ Inverse Cup and Handle Pattern

Happens during a downtrend.

The cup portion has a reverse U-shaped appearance.

The bulls are getting weaker as they are unable to drive the prices above the last high.

Subhasish Pani uses this a lot in stocks to spot bearish trades.
@niki_poojary 3/ Double Bottom Pattern

It is a bullish pattern that has the shape of a "W".

The market tries twice to break the lows but is unsuccessful.

This is a reversal pattern to observe during a downtrend for a bullish trade.
@niki_poojary 4/ Double Top Pattern

It is a bearish pattern that has the shape of an "M".

The market tries twice to break the highs but is unsuccessful.

This is a reversal pattern to observe during an uptrend for a bearish trade.
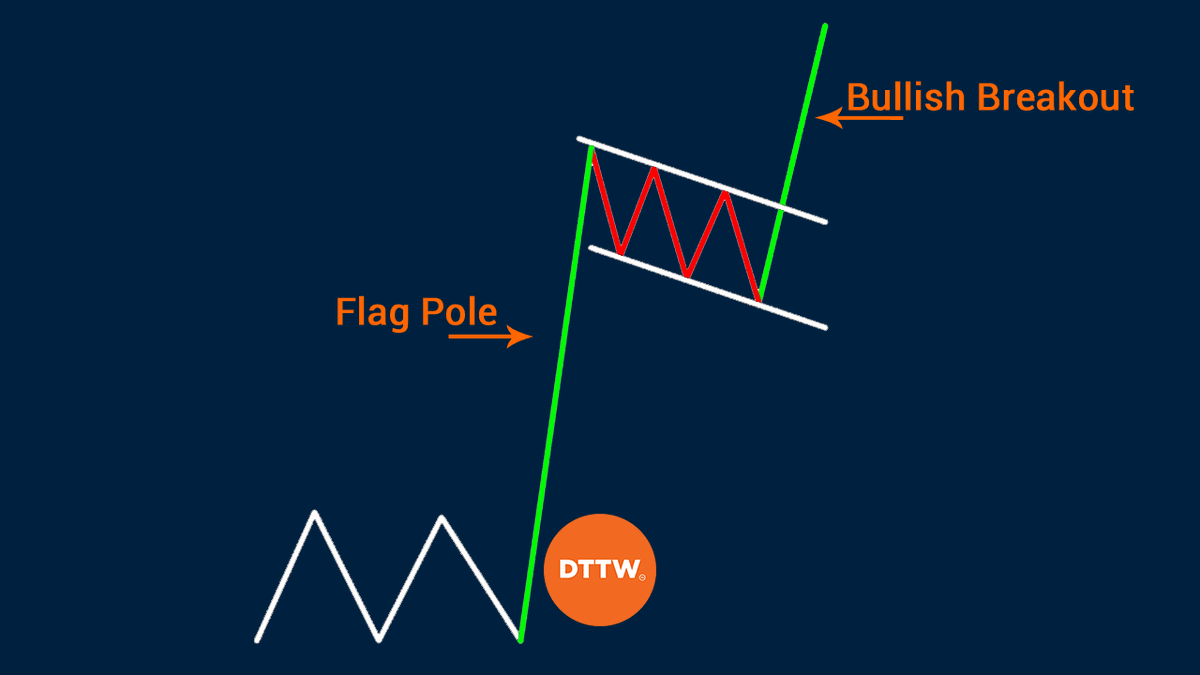
@niki_poojary 5/ Bullish Flag Pattern

Happens after a trending move.

After constant lower lows in a downward sloping rectangle, the market breaks out.

These patterns are very powerful if the down move is still higher than 50% of the distance of the up move.
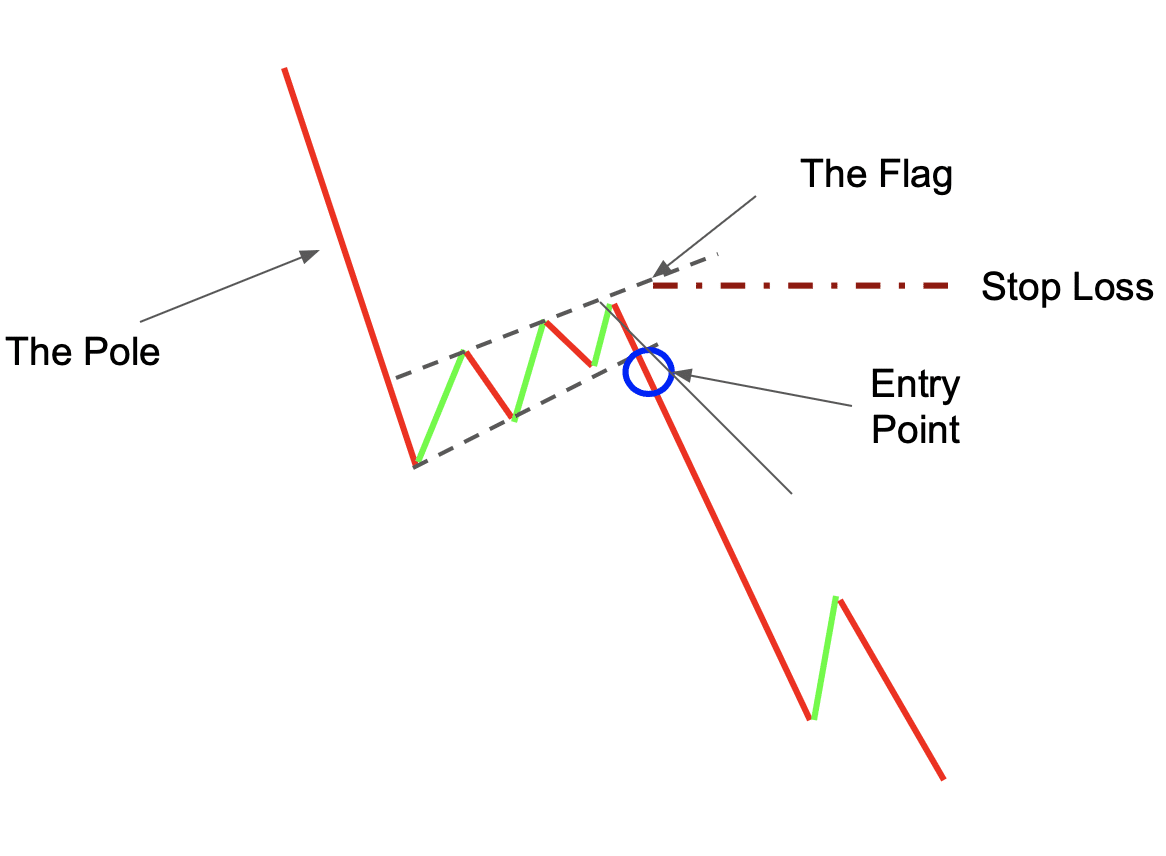
@niki_poojary 6/ Bearish Flag Pattern

Happens after a trending move.

After constant higher highs in an uptrend-sloping rectangle, the market breaks down.

These patterns are very powerful if the up move is still lower than 50% of the distance of the down move.
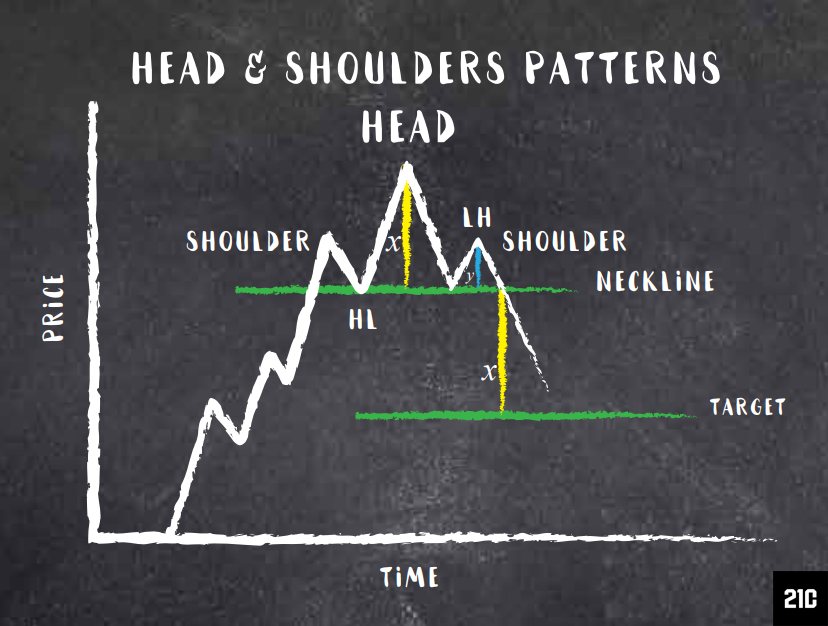
@niki_poojary 7/ Head and Shoulders Pattern

Signifies a change from a bullish to a bearish trend.

The bullish momentum is reducing as bulls are not able to take out their highs with force.

Bears are fully in control.

We look for a trade below the breakdown of a support in such patterns.
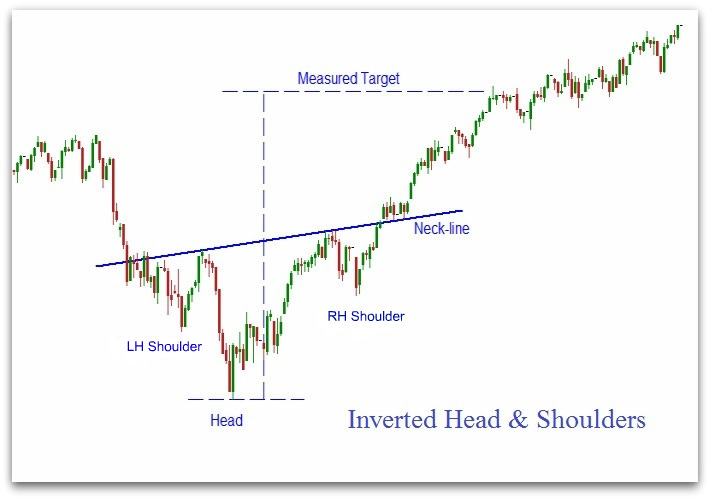
@niki_poojary 8/ Inverse Head and Shoulders Pattern

Signifies a change from a bearish to a bullish trend.

The bearish momentum is reducing as bears are not able to take out the lows with force.

Bulls are fully in control.

We trade above the breakout of a resistance in such patterns.
@niki_poojary If you really liked this thread

Here's another we think you'd love: https://t.co/l7vakmDdLB

More from Aditya Todmal

TradingView isn't just charts

It's much more powerful than you think

9 things TradingView can do, you'll wish you knew yesterday: 🧵

Collaborated with @niki_poojary

1/ Free Multi Timeframe Analysis

Step 1. Download Vivaldi Browser

Step 2. Login to trading view

Step 3. Open bank nifty chart in 4 separate windows

Step 4. Click on the first tab and shift + click by mouse on the last tab.

Step 5. Select "Tile all 4 tabs"


What happens is you get 4 charts joint on one screen.

Refer to the attached picture.

The best part about this is this is absolutely free to do.

Also, do note:

I do not have the paid version of trading view.


2/ Free Multiple Watchlists

Go through this informative thread where @sarosijghosh teaches you how to create multiple free watchlists in the free


3/ Free Segregation into different headers/sectors

You can create multiple sections sector-wise for free.

1. Long tap on any index/stock and click on "Add section above."
2. Secgregate the stocks/indices based on where they belong.

Kinda like how I did in the picture below.
A THREAD ON @SarangSood

Decoded his way of analysis/logics for everyone to easily understand.

Have covered:
1. Analysis of volatility, how to foresee/signs.
2. Workbook
3. When to sell options
4. Diff category of days
5. How movement of option prices tell us what will happen

1. Keeps following volatility super closely.

Makes 7-8 different strategies to give him a sense of what's going on.

Whichever gives highest profit he trades in.


2. Theta falls when market moves.
Falls where market is headed towards not on our original position.


3. If you're an options seller then sell only when volatility is dropping, there is a high probability of you making the right trade and getting profit as a result

He believes in a market operator, if market mover sells volatility Sarang Sir joins him.


4. Theta decay vs Fall in vega

Sell when Vega is falling rather than for theta decay. You won't be trapped and higher probability of making profit.


More from All

You May Also Like