Authors The Chartians

Do Share the above tweet 👆
These are going to be very simple yet effective pure price action based scanners, no fancy indicators nothing - hope you liked it.
https://t.co/JU0MJIbpRV
52 Week High
One of the classic scanners very you will get strong stocks to Bet on.
https://t.co/V69th0jwBr
Hourly Breakout
This scanner will give you short term bet breakouts like hourly or 2Hr breakout
Volume shocker
Volume spurt in a stock with massive X times


Kindly RETWEET and LIKE if you feel our efforts adding to your knowledge.

🩸Types of
There are 4\u20e3 type of #BREAKOUTS
— The Chartians (@chartians) January 22, 2021
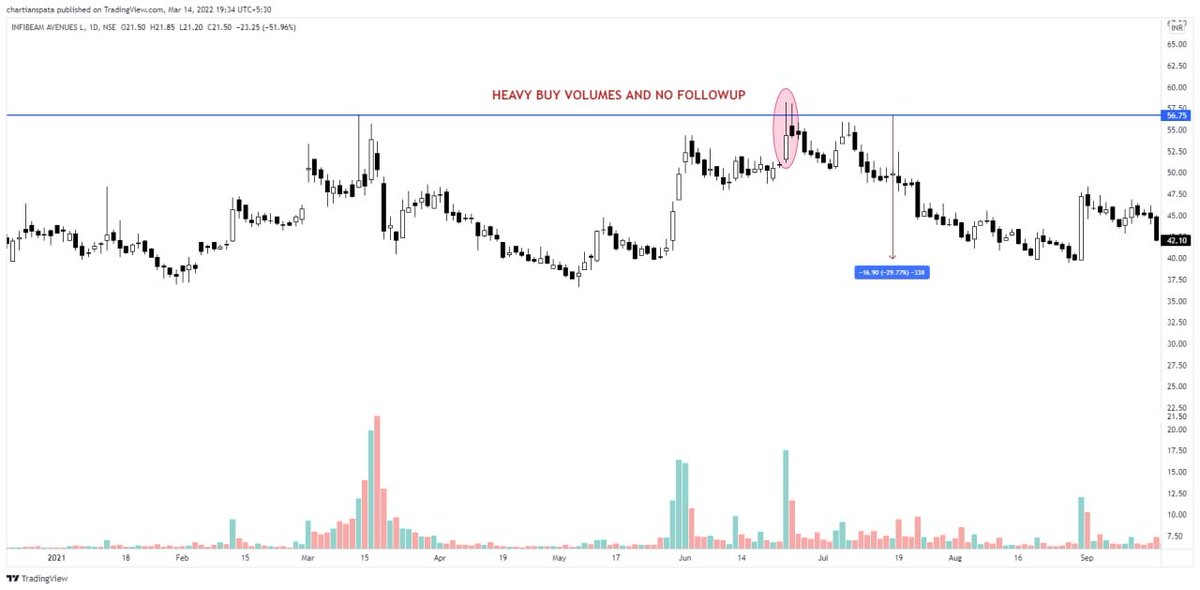
1\u20e3 Breakout with no retest
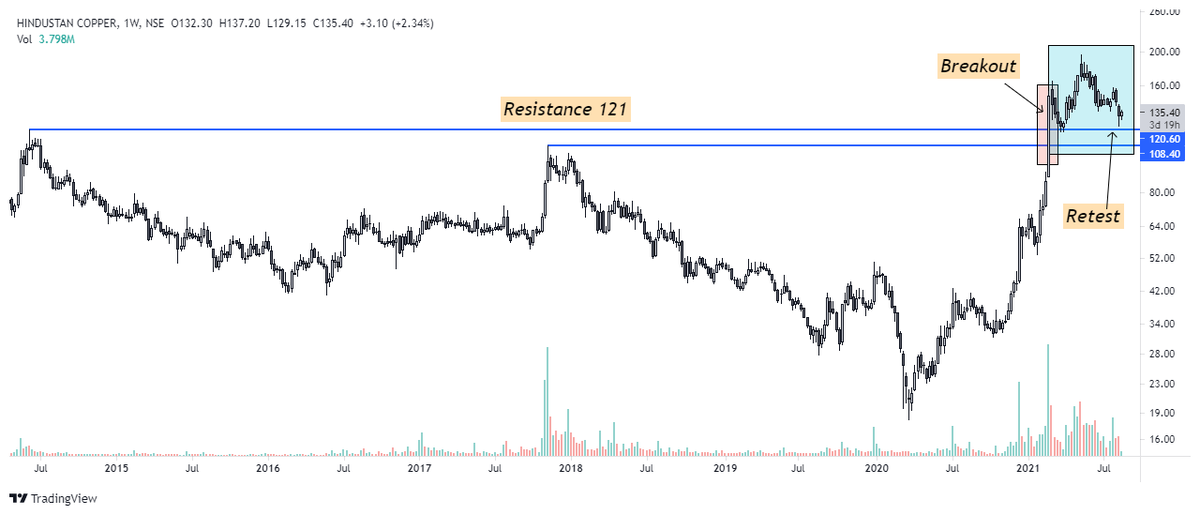
2\u20e3 Breakout with a re-test
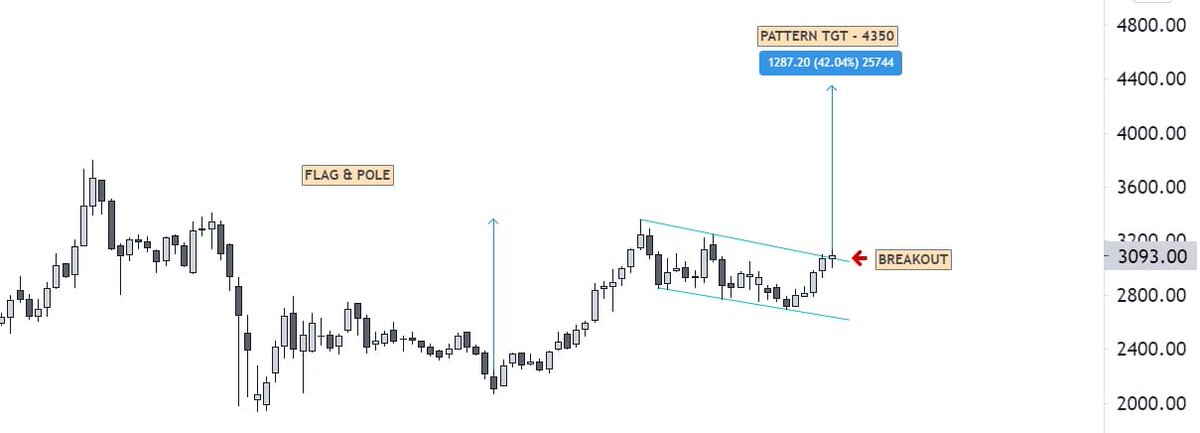
3\u20e3 Breakout with a hard re-test
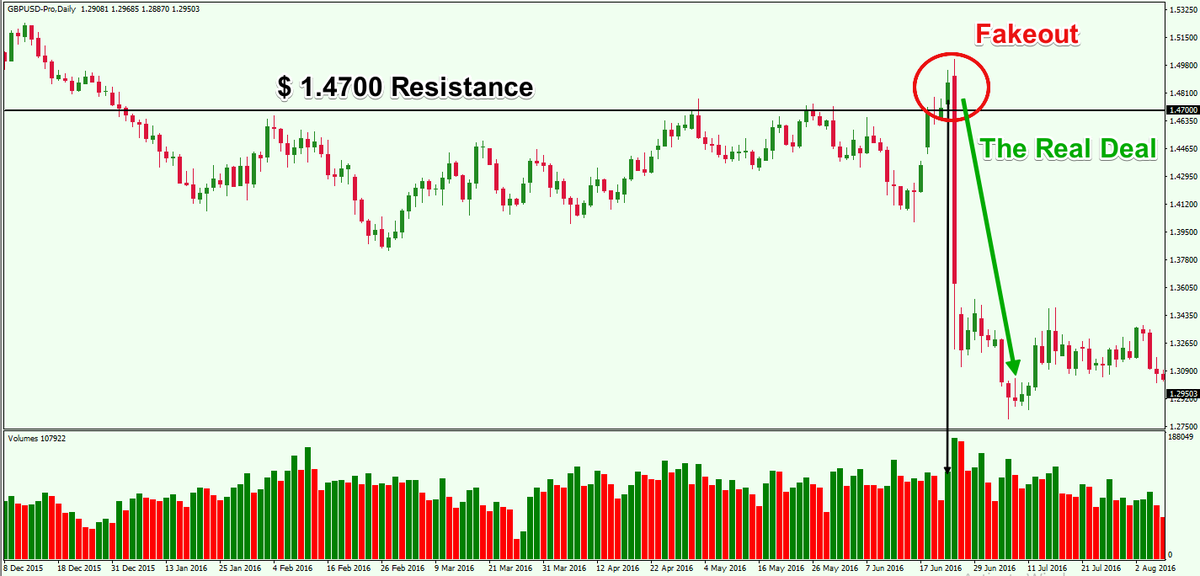
4\u20e3 Failed breakout.
We Will Explain it one by one with examples. Kindly Retweet it if you find it useful. #Nifty
🩸 Detailed guide on TX, a free trading tool by
A detailed guide on #TX3 by @EdelweissFin
— The Chartians (@chartians) August 8, 2021
Software worth 50,000/- for F R E E \U0001f3c6
Scroll down \U0001f447 for detailed analysis
(Using for 2+years)
User guide PDF \U0001f4d9 https://t.co/Ke7Bn2jRO8 #chartians #momentum #StockMarketindia #trading #tx3 #edelweiss pic.twitter.com/6M7TCYpPLc
🩸 Fibonacci retracement and golder ratio - Part
\U0001fa78FIBONACCI retracement and GOLDEN RATIO - PART 2
— The Chartians (@chartians) August 8, 2021
Before we move forward, kindly like and retweet if you find our content is adding something to your knowledge. pic.twitter.com/HDlcOa5ZPP
🩸 Fibonacci retracement and golden ratio - Part
\U0001fa78FIBONACCI retracement and GOLDEN RATIO
— The Chartians (@chartians) August 7, 2021
Before we move forward, kindly like and retweet if you find our content is adding something to your knowledge. pic.twitter.com/iVC6W3pqks
And Edge comes with Data and Resources.
But 90% of Retail don’t have access to authentic educational data.
This compilation is surely a 50,000₹ Technical Analysis’s course in itself 🧵
https://t.co/PTeE1Hms9Y
Trading on chart patterns is difficult, Until you see this:
— The Chartians (@chartians) August 6, 2022
Free Technical Analysis course (1/10) \U0001f9f5
https://t.co/2JvDpSzHds
Trading on chart patterns is difficult, Until you read this ! \u26a1\ufe0f
— The Chartians (@chartians) August 21, 2022
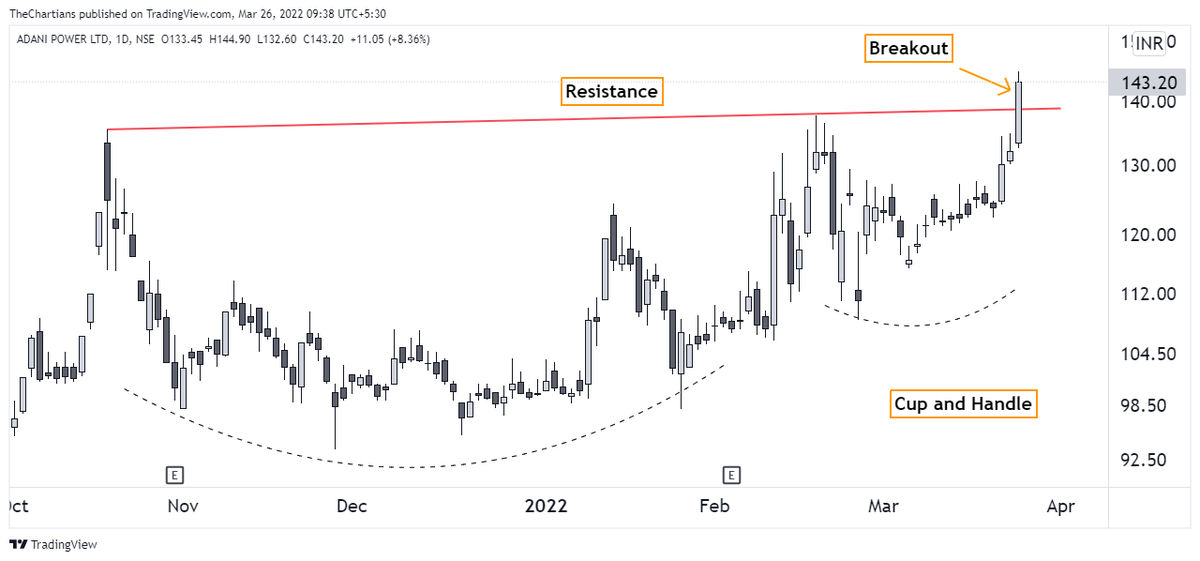
Everything about Cup and Handle Pattern
Free Technical Analysis course (2/10) \U0001f9f5
https://t.co/QuX8o1MUbo
Trading on chart patterns is difficult until you read this !\u26a1\ufe0f
— The Chartians (@chartians) August 28, 2022
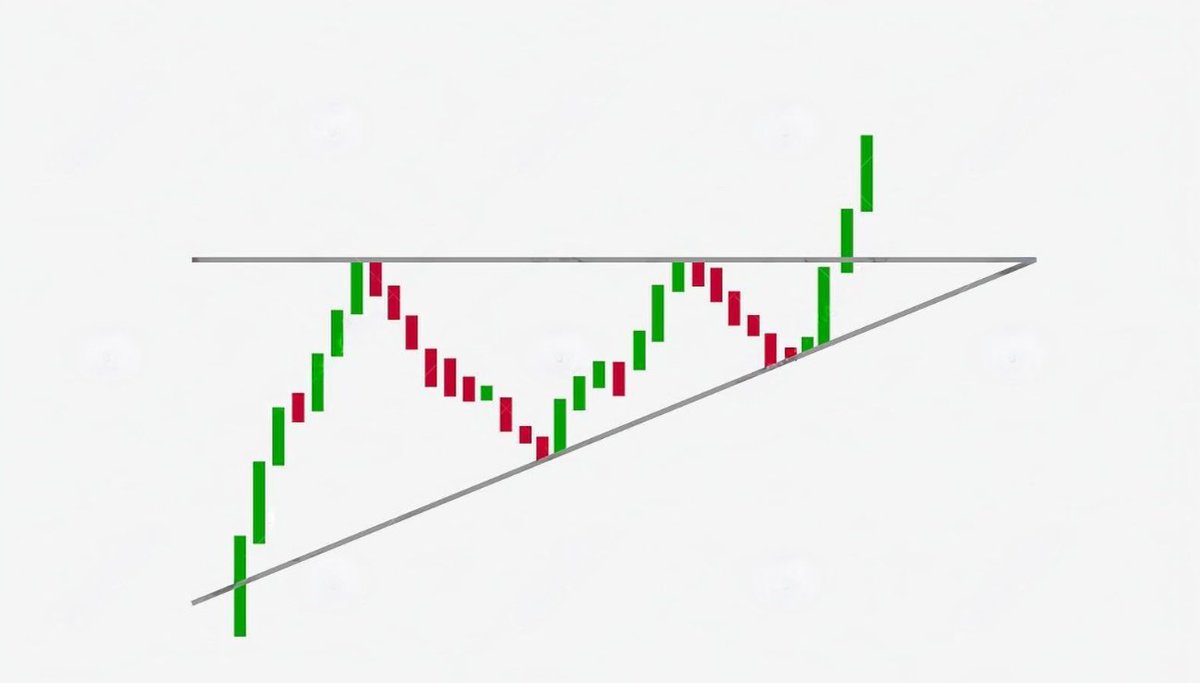
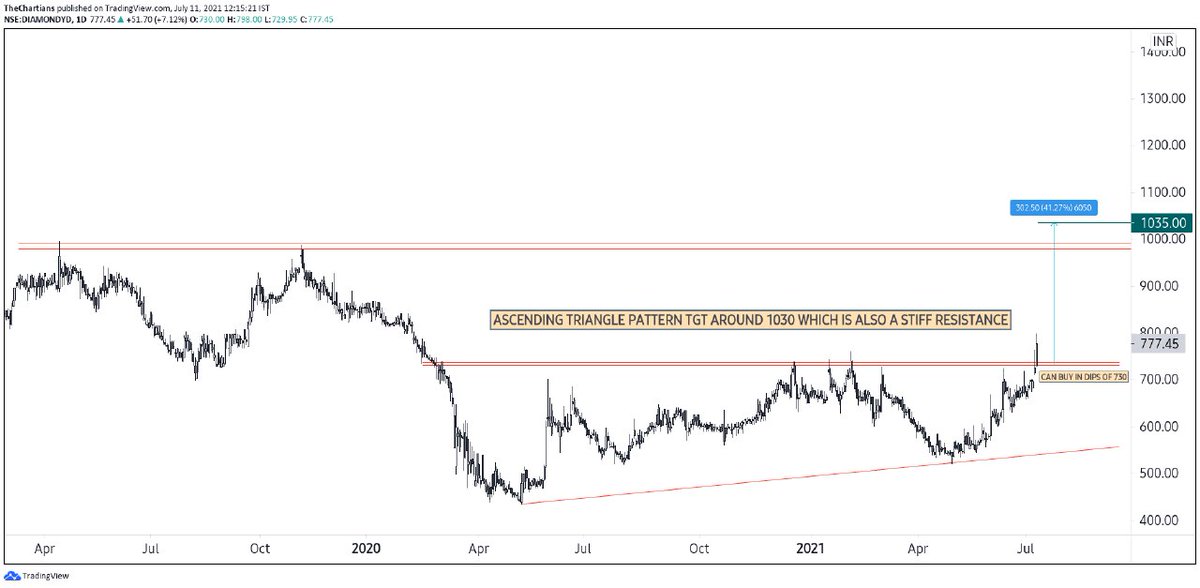
Everything about Ascending Triangle Pattern
Free Technical Analysis course (3/10) \U0001f9f5
https://t.co/5dBdHq9CBY
Trading on chart patterns is difficult, Until you read this ! \u26a1\ufe0f
— The Chartians (@chartians) October 9, 2022
Everything about Head and Shoulder Pattern
Free Technical Analysis course (4/10) \U0001f9f5


#chartkyaboltahai
- 730 dop can be bought for tgt of 1000.
- Stock has made first HH-HL.
- Breaking previous swing low.
- Ascending traingle pattern on daily.
@ydstartupreneur
@caniravkaria bhaiji looks good on charts https://t.co/iwy4wXUiJf
#chart kya bolta hai?#kiska weekly chart hai?
— Yash Dugar (@ydstartupreneur) July 10, 2021
It is said that when weekly trend reversals are with huge volumes & strong RSI the stock becomes a good positional trade/investment.
Those who will answer it fully correctly will get access to our full report on it by @FinterestC pic.twitter.com/I4DX29TpRg
Dip*
Here is the
Glad that many could guess/ know the candle stick pattern and mainly know how to use it.
— The Chartians (@chartians) July 24, 2021
The one shown in the image was bullish Harami
The word Harami comes from an old Japanese word meaning pregnant.. pic.twitter.com/4qBDCyY2Pq