SAnngeri's Categories
SAnngeri's Authors


Latest Saves


Please share your love by liking and retweeting if you find it useful to you and your followers.
I have been called Influencer. I m happy if I have been influencing in the right direction.
I have been called the trainer and am happy with that as well as not many get a chance to teach their experience.
I am putting down all the efforts I have put in these 3 years
1) Money control Article: https://t.co/Xsm1dQQvdJ
How Vishal Mehta undertook a journey from discretionary to system trading for consistent gains
@moneycontrolcom
2) F2F : https://t.co/X3z8R8VOnp
Directional Option Selling (Which has more than 11 lac View) It's a good webinar who wants to start their systematic trading journey
@elearnmarkets @vivbajaj
3) Fyers 30 Day Winning challenge 6 months in a raw:
https://t.co/wk8hKBCMPw
This is awarded when you are profitable for straight 6 months consecutively. This will help to understand the thought process.
@fyers1 @tejaskhoday


Grab a cup of coffee, today I will tell you about all the tools and services I use in my investing journey
Some are free, some are paid but all of them are guaranteed to deliver value
Lets dive right in!
Service # 1
Name: @Regulation30
Type: Paid
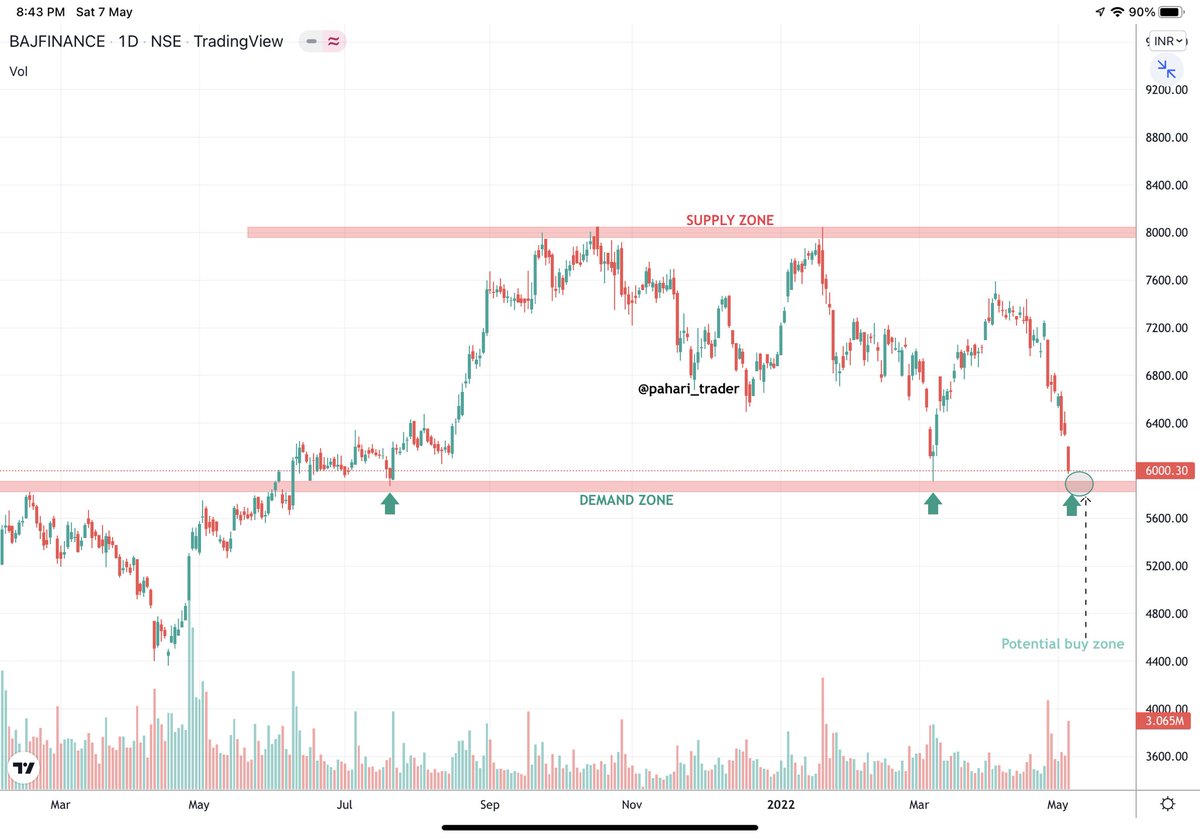
Regulation30 is my go to source to hunt for exchange filings that are worth studying further
This is also the source where I get lot of special situation ideas that aren't that widely known

Every day thousands of filings are made over the exchange, among them only a handful are worth studying
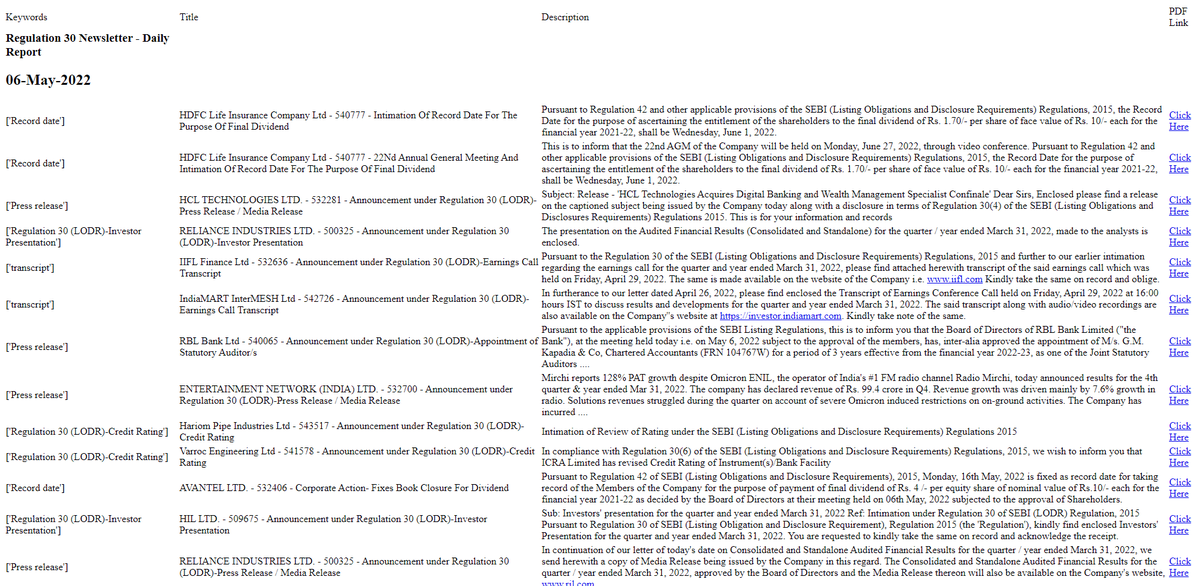
Regulation 30 filters out the noise and sends me a daily email of every exchange filing that is worth reading
Here is a snapshot of the email they sent me yesterday
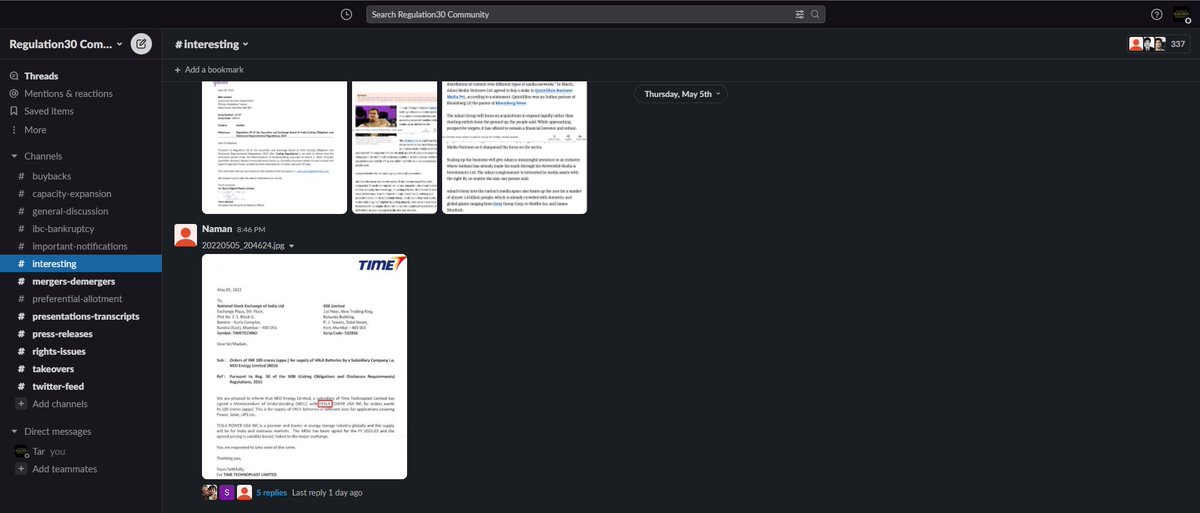
Apart from the newsletter, there is a Slack community where founders of Regulation30 routinely share great insights into less known companies
Service # 2
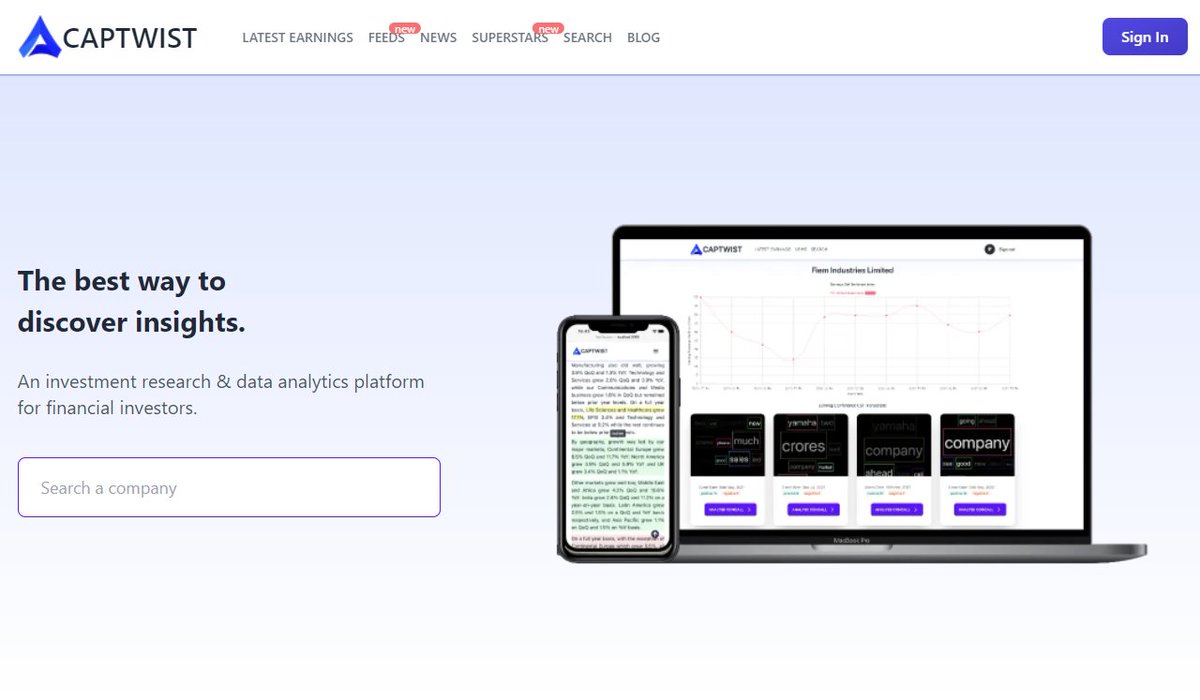
Name: CapTwist
Type: Free
Wouldn't it be cool if you could search across all exchange filings of all companies via keywords or phrases and join them together as a theme?
Well, CapTwist does just that!
https://t.co/9mwFRPZkws

As per Normal Distribution 68% of the time movement is with 1% SD Limits.
For 95% pf the times movement is within 2% SD limits.
And its only 0.3% of the times that movement exceeds 3 SD.
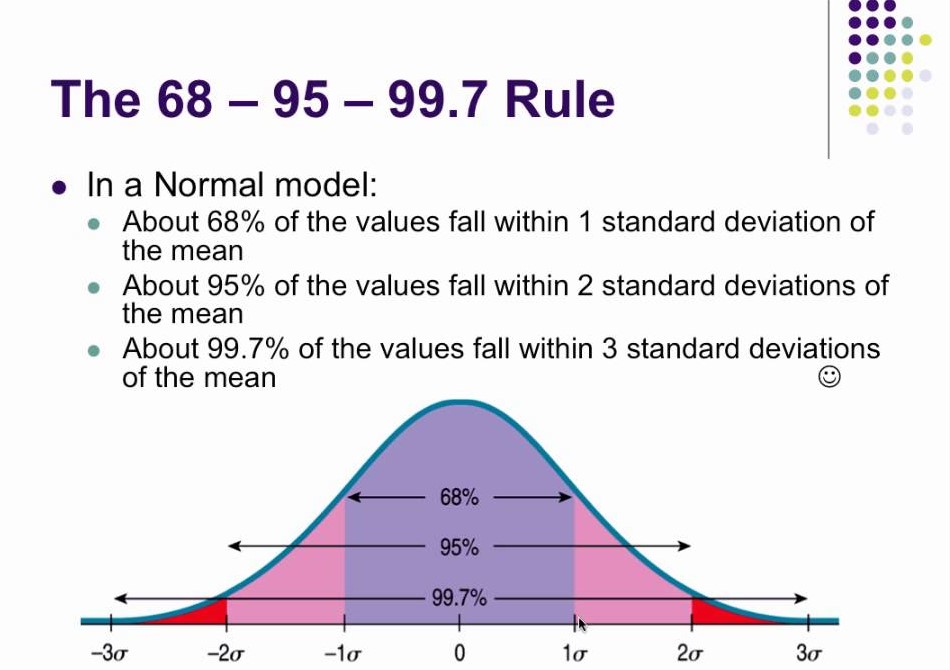
Since 95% covers a lot of ground that's why 2SD is considered to be a a safe range for most events.
The farther we move from the average, chances of occurrence go down. This is what Taleb sahab calls Tail risk, because it lies in the tail of the standard distribution curve.
Normal distribution occurs everywhere. See this
The Galton Machine shows order from randomness. Each ball bounces left or right at random, 12 times, but together where they fall can be predicted - the normal distribution. This one made by: https://t.co/oI9wOGq7nG pic.twitter.com/VQtVu66OSE
— Tom Stafford (@tomstafford) April 19, 2018
Bollinger Band, which is a very popular indicator has a setting of 2SD. Because its expected that 95% of the time moves will be confined to 2SD limits.
When we say that price is at upper/lower Bollinger band, we are saying that it has reached 2 SD limits and likely to reverse.
Now coming to current scenario, open Nifty daily chart and apply two bollinger Bands on it.
First with default setting and in second change settings to 3 standard deviation.
Crossing 3 SD boundary means that Nifty is now in very rare territory where it has been only 0.3%

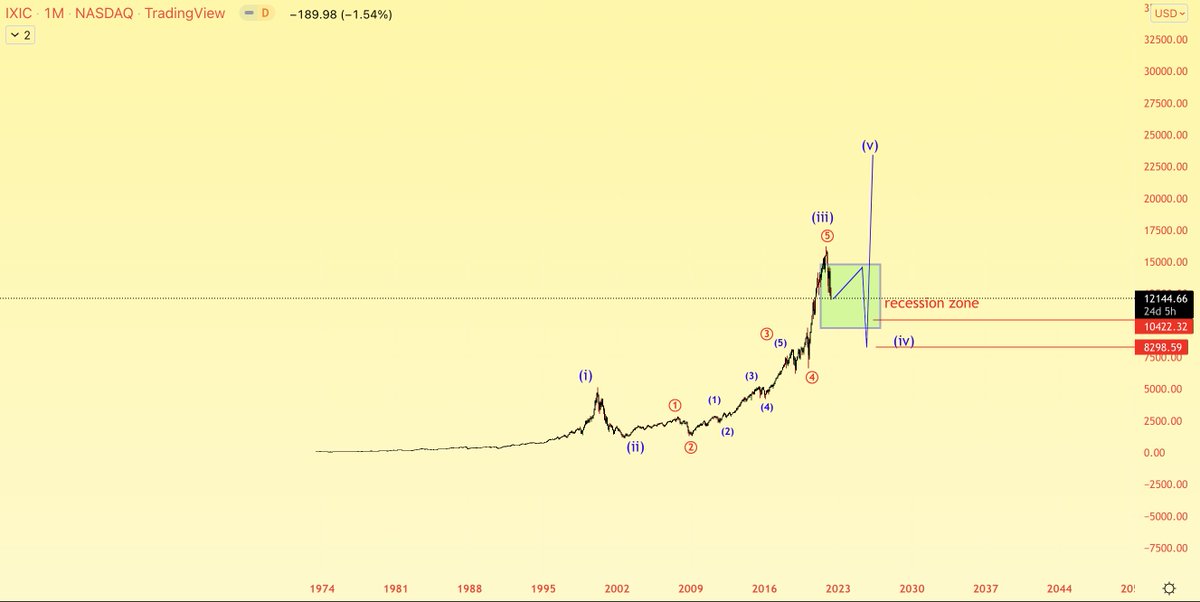
$NASDAQ broke ATH , so sharing some thoughts for next coming decade. pic.twitter.com/YS8sD6wbSA
— \u1d00\u029f\u1d1b\ua731\u1d1b\u0280\u1d07\u1d07\u1d1b \u0299\u1d07\u1d1b\ua731 (@AltstreetBet) December 28, 2019


Do Share the above tweet 👆
These are going to be very simple yet effective pure price action based scanners, no fancy indicators nothing - hope you liked it.
https://t.co/JU0MJIbpRV
52 Week High
One of the classic scanners very you will get strong stocks to Bet on.
https://t.co/V69th0jwBr
Hourly Breakout
This scanner will give you short term bet breakouts like hourly or 2Hr breakout
Volume shocker
Volume spurt in a stock with massive X times


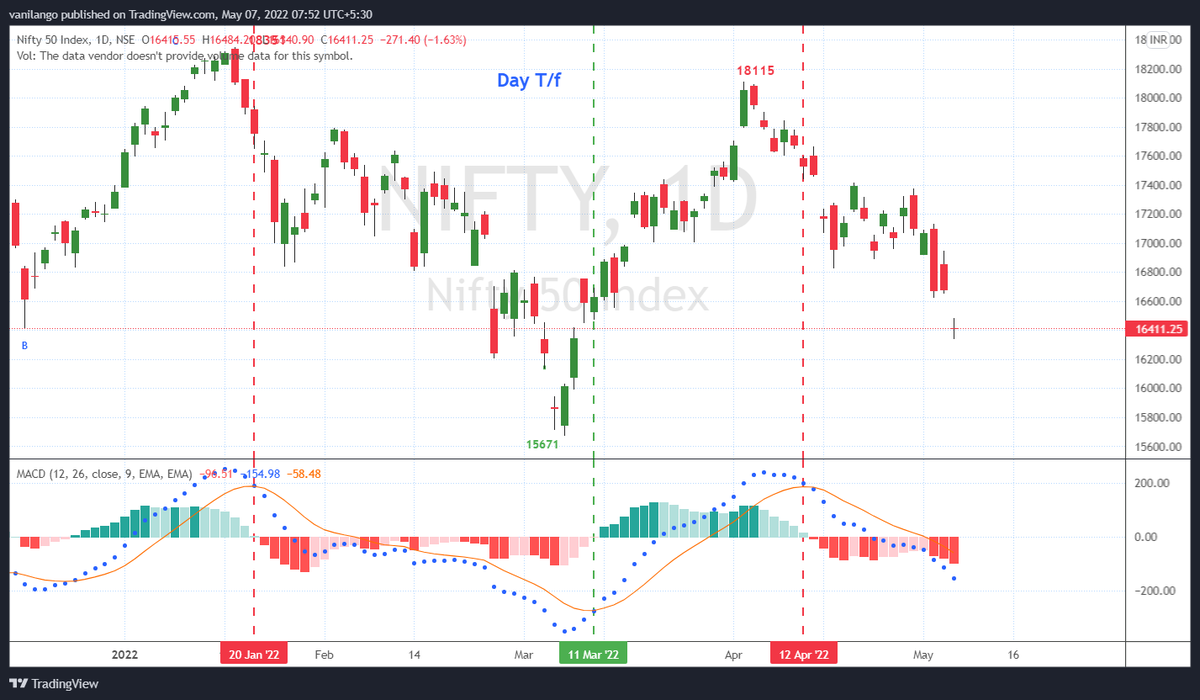

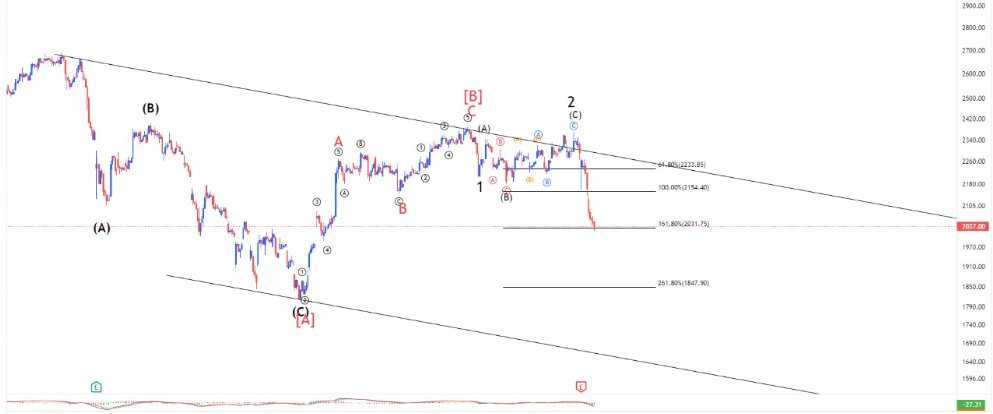
#NIFTY in Regression Channel.
— Piyush Chaudhry (@piyushchaudhry) April 30, 2022
A rectangular consolidation around the central Line of Best Fit, with no such reversal characteristics on display yet.
For it to revisit the upper band, odds would increase only on a break above ~17450.
Else, it's a slippery slope. pic.twitter.com/4OT7JM1TJY

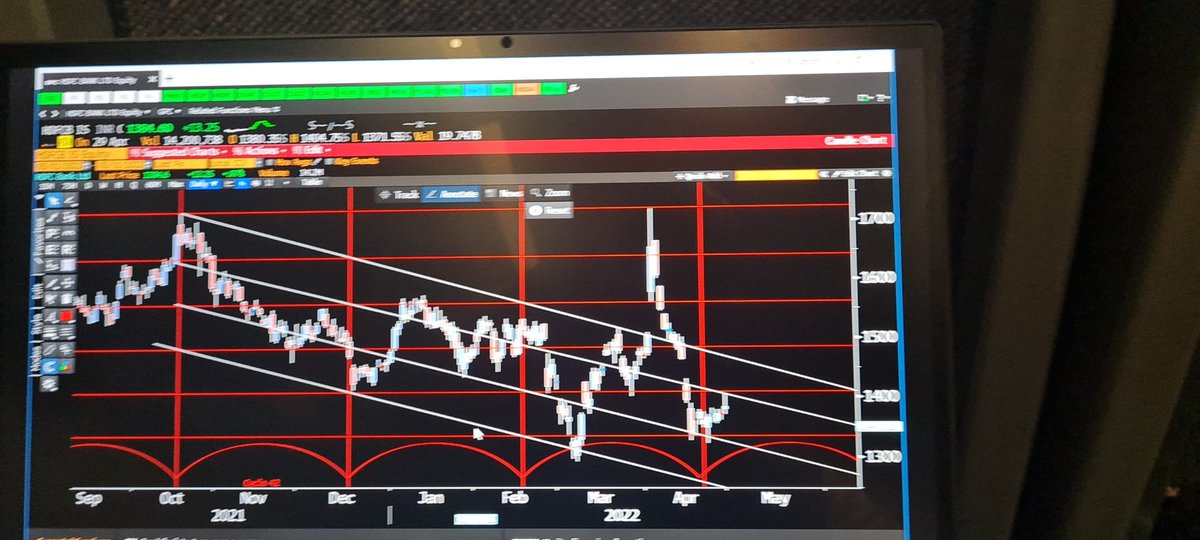
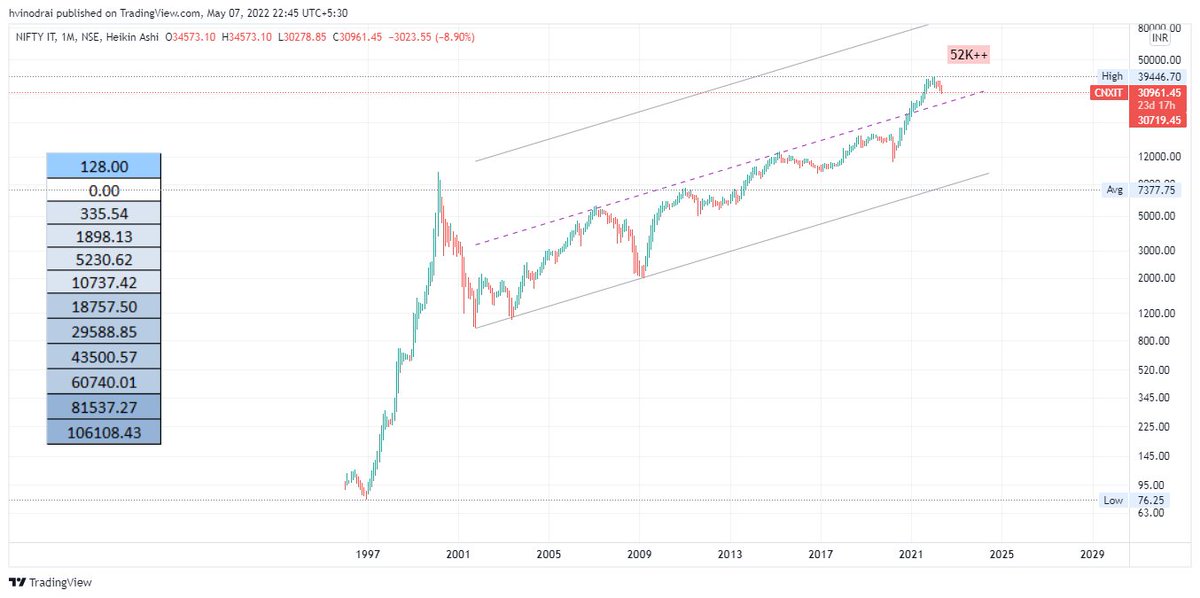
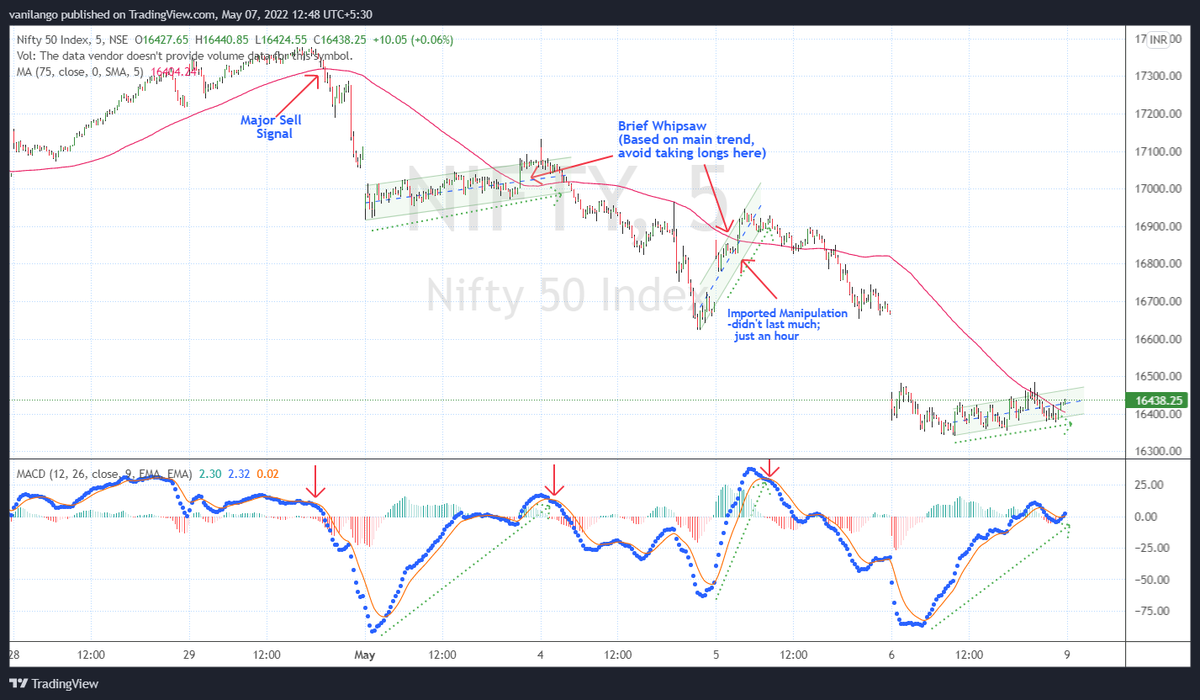
Earlier chart in 5 Min. t/f with 75Sma
Relate oscillator movement to #priceaction & you'll notice price rise as "corrective" based on the feeble rise compared to indicator's rise except once. https://t.co/Tt1kD3iPlY
Good afternoon master,
— Sunny Singh (@SurendraSinghJi) May 7, 2022
What does sma 5 means with 25 ma as seen in this chart.
How to use it with macd master?
Already following systems that i learned from you.
Want to add another learning from this.
Keep blessings master \U0001f64f