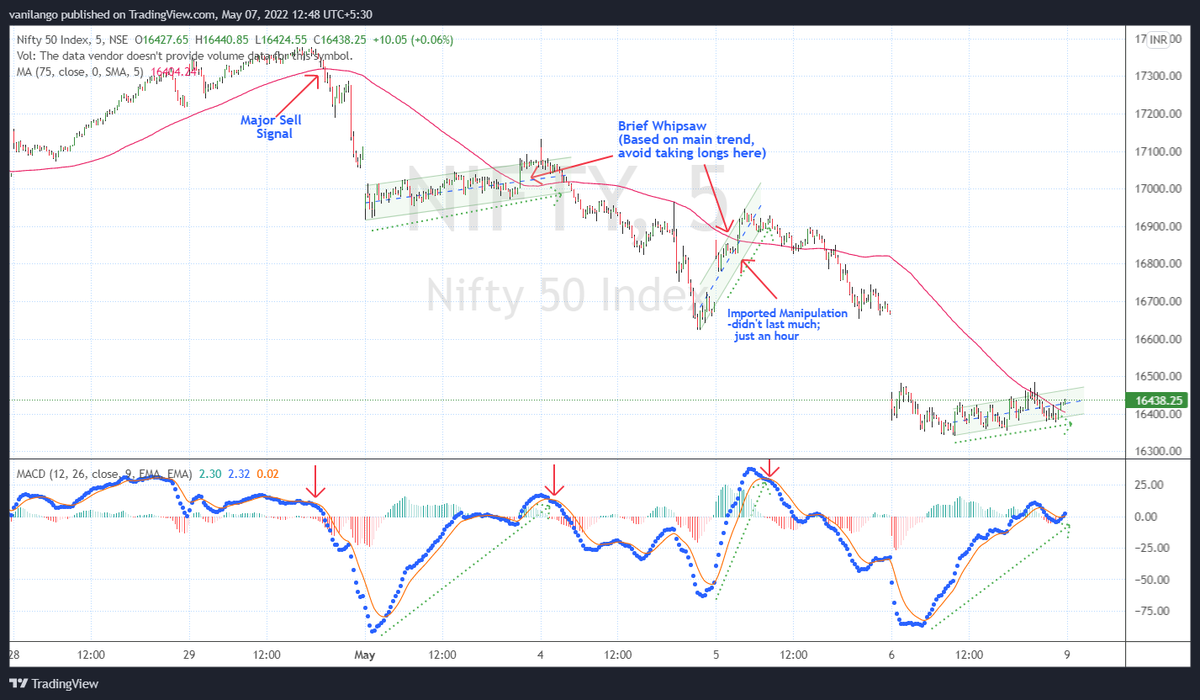
25Sma in "15 min. t/f" is same as 75 Sma in "5 min. t/f" which we use as 1 Day average
Earlier chart in 5 Min. t/f with 75Sma
Relate oscillator movement to #priceaction & you'll notice price rise as "corrective" based on the feeble rise compared to indicator's rise except once. https://t.co/Tt1kD3iPlY
Good afternoon master,
— Sunny Singh (@SurendraSinghJi) May 7, 2022
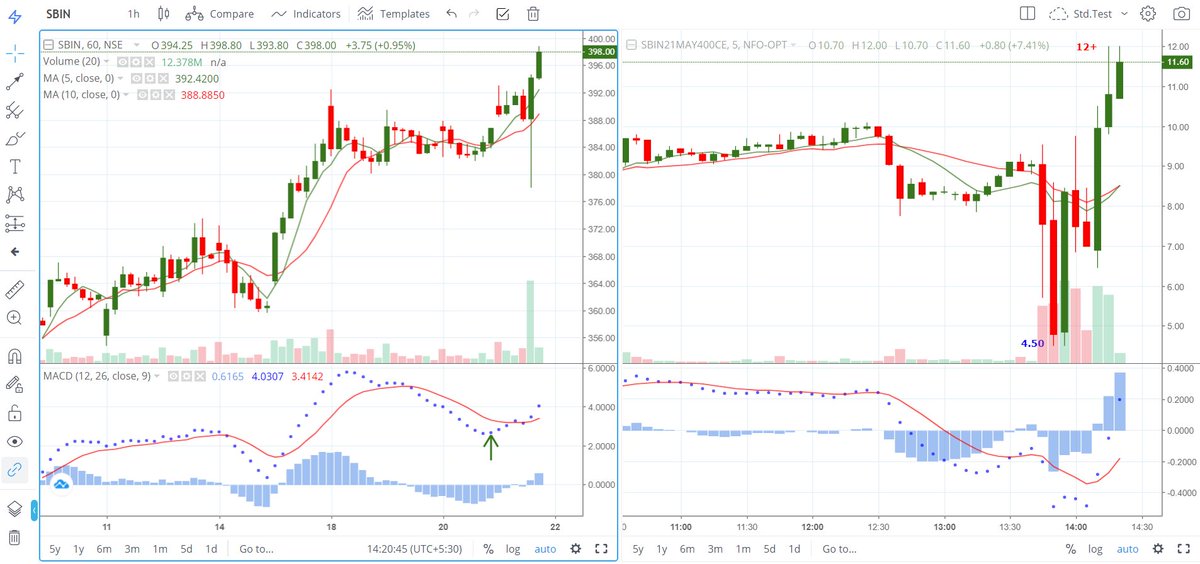
What does sma 5 means with 25 ma as seen in this chart.
How to use it with macd master?
Already following systems that i learned from you.
Want to add another learning from this.
Keep blessings master \U0001f64f
More from Van Ilango (JustNifty)
A big rerating underway for #McDowell based on price action.
Holding 660 & 680, poised for big run in the days, weeks & months ahead.
Volume goes with rises
Holding 660 & 680, poised for big run in the days, weeks & months ahead.
Volume goes with rises
Thank you.\U0001f64f
— Van Ilango (JustNifty) (@JustNifty) August 18, 2021
A fresh input for you. #McDowell
A major triangle break out in the coming months.
Presently poised to move out of recent consolidation pic.twitter.com/J15F06ODUq

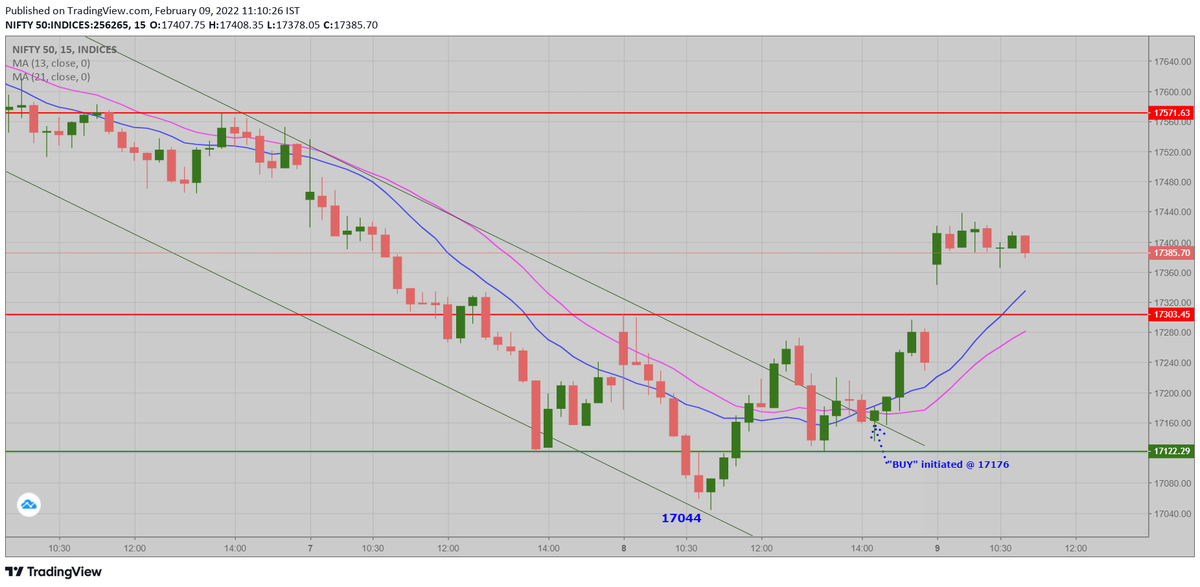
You could follow "#Movingaverages Trading system with 2 MA (13 & 21Sma)" in simple way or add 1 or 2 additional strategies
Simple: When 13 moves above 21 in "15 Minute t/f for Intraday only", BUY
When 13 moves below 21 in "15 Minute t/f for Intraday only", SELL as in a SAR system
Addl.strategy: When prices move far from MA, say 150 to 200 pts, "Part book" & re-enter when prices pull back to MA
Choose to do this way 1 or 2 times only for intraday
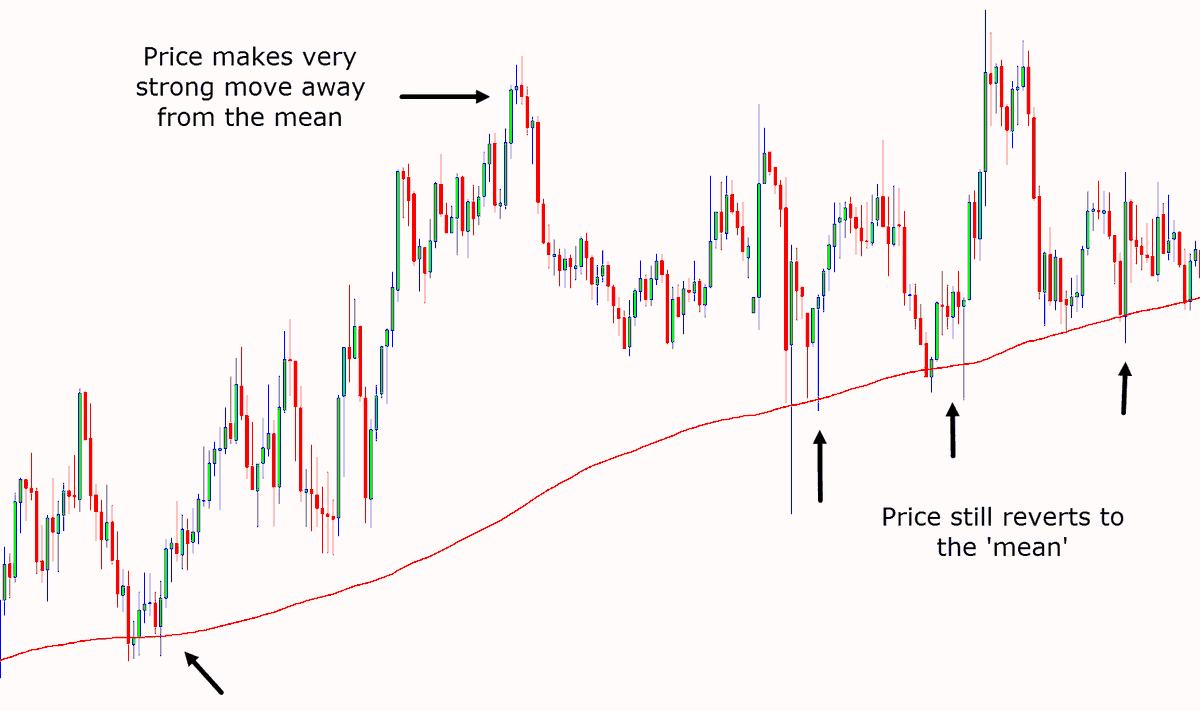
Idea is "Mean Reversion" - Prices tend to move back to MA IF they move far away from MA in a trending phase.🙏
Simple: When 13 moves above 21 in "15 Minute t/f for Intraday only", BUY
When 13 moves below 21 in "15 Minute t/f for Intraday only", SELL as in a SAR system
Master just one doubt about the re-entry part
— Sunny Singh (@SurendraSinghJi) February 10, 2022
You mentioned to re-enter at 17430 levels.
How to initiate the trade at the lowest point when the candle is in the formation mode.
Is it that when the price touches 21ma we should entry longs till 13ma is above 21ma.
Show path \U0001f64f
Addl.strategy: When prices move far from MA, say 150 to 200 pts, "Part book" & re-enter when prices pull back to MA
Choose to do this way 1 or 2 times only for intraday
Idea is "Mean Reversion" - Prices tend to move back to MA IF they move far away from MA in a trending phase.🙏