#repost
#NIFTY in Regression Channel.
— Piyush Chaudhry (@piyushchaudhry) April 30, 2022
A rectangular consolidation around the central Line of Best Fit, with no such reversal characteristics on display yet.
For it to revisit the upper band, odds would increase only on a break above ~17450.
Else, it's a slippery slope. pic.twitter.com/4OT7JM1TJY
More from Piyush Chaudhry
In such a case, H&S can be either a continuation pattern or compound fulcrum.
This is how to differentiate:
• if right shoulder is smaller than left, most likely a continuation H&S
• if right is same or higher than left, and the price is not coming to neckline, most likely CF
This is how to differentiate:
• if right shoulder is smaller than left, most likely a continuation H&S
• if right is same or higher than left, and the price is not coming to neckline, most likely CF
sir a doubt does head & shoulders work in down trend ? pic.twitter.com/dytYmbzOfp
— Vega_Greek (@VegaGreek) May 13, 2021
More from Niftylongterm


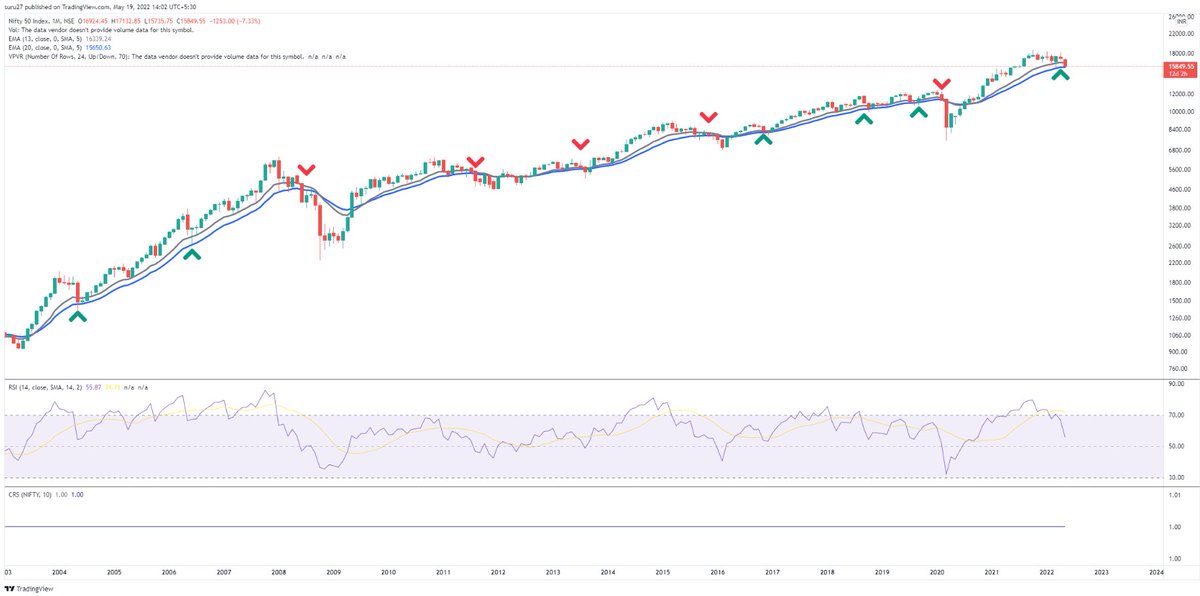


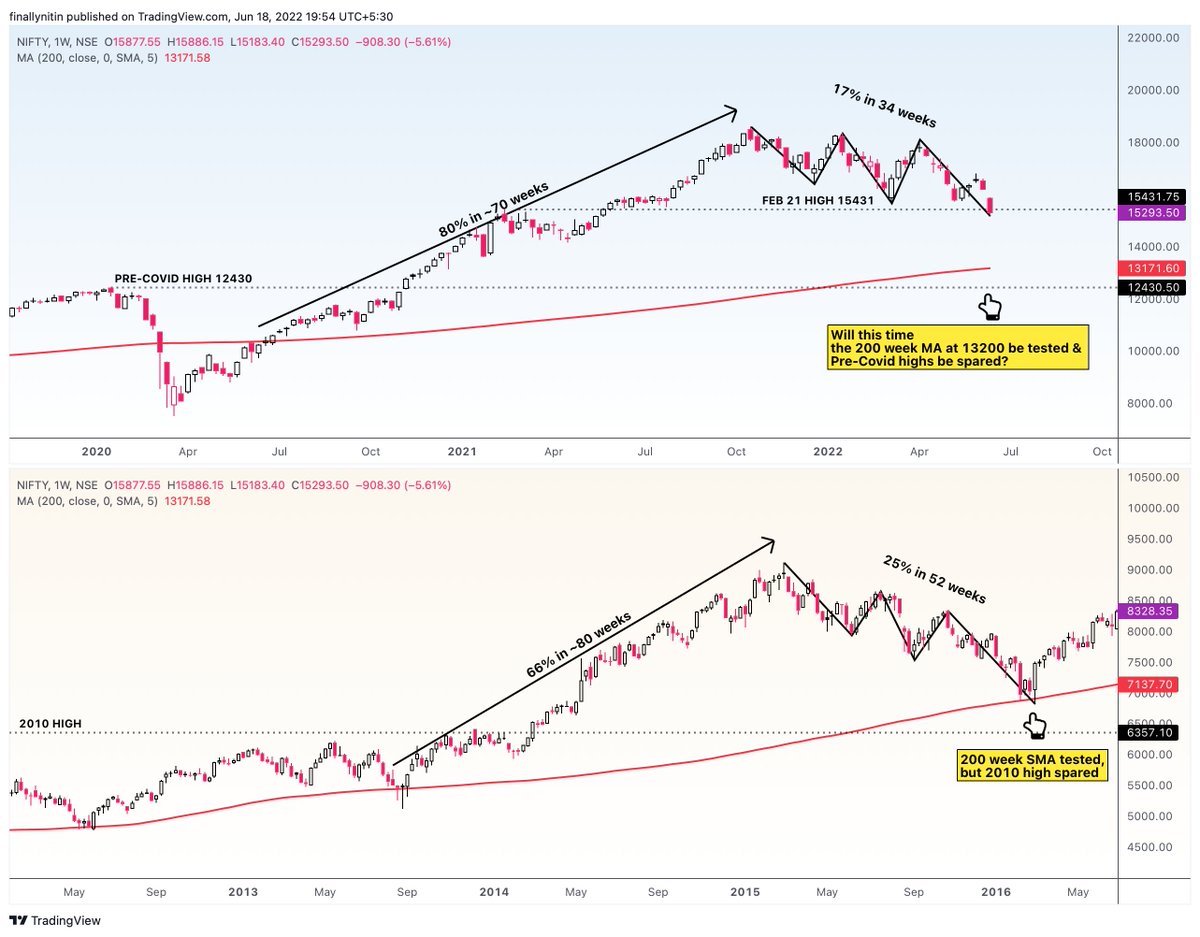
#NIFTY
15 Months to this post. No change in the larger projections.
15 Months to this post. No change in the larger projections.
Long Term Chart of the Year.#NIFTY - Wave 5 (Cycle Degree) Target Zone of 25000-34000 by 2024-2027.
— Piyush Chaudhry (@piyushchaudhry) December 19, 2020
Reassessment on a breach below Blue Trendline. A breach is not a necessary invalidation. Depends on internals.
The dashed path is for representative purpose only. #ElliottWave pic.twitter.com/1xVY4OSr5T