The farther we move from the average, chances of occurrence go down. This is what Taleb sahab calls Tail risk, because it lies in the tail of the standard distribution curve.
Bringing Data Science to Nifty Analysis. A small 🧵
As per Normal Distribution 68% of the time movement is with 1% SD Limits.
For 95% pf the times movement is within 2% SD limits.
And its only 0.3% of the times that movement exceeds 3 SD.
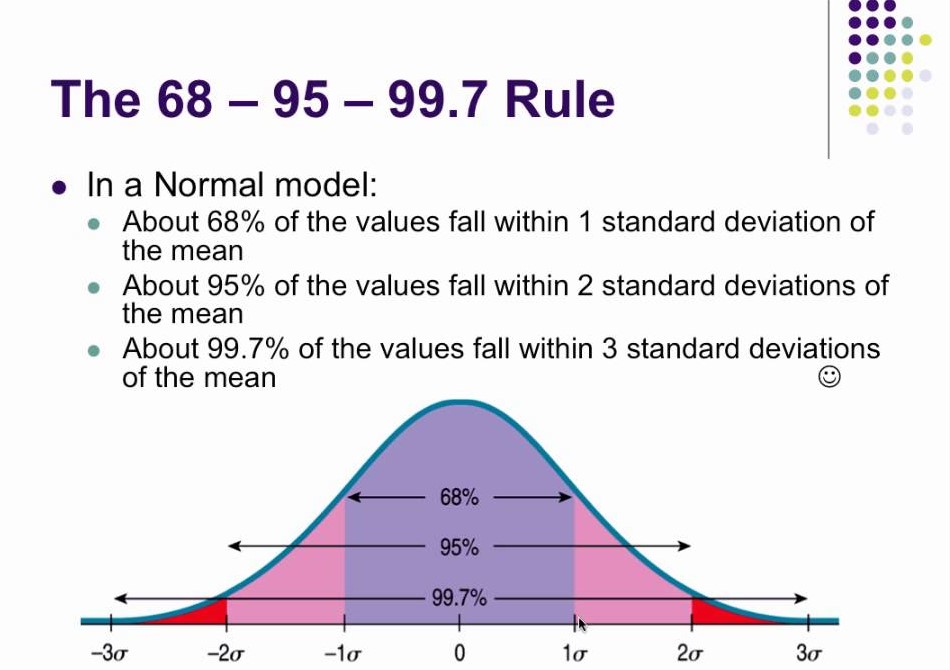
The farther we move from the average, chances of occurrence go down. This is what Taleb sahab calls Tail risk, because it lies in the tail of the standard distribution curve.
https://t.co/HHwUpIXTRG
The Galton Machine shows order from randomness. Each ball bounces left or right at random, 12 times, but together where they fall can be predicted - the normal distribution. This one made by: https://t.co/oI9wOGq7nG pic.twitter.com/VQtVu66OSE
— Tom Stafford (@tomstafford) April 19, 2018
When we say that price is at upper/lower Bollinger band, we are saying that it has reached 2 SD limits and likely to reverse.
First with default setting and in second change settings to 3 standard deviation.
Crossing 3 SD boundary means that Nifty is now in very rare territory where it has been only 0.3%


More from Professor
How to select good Breakout Trades:
Breakouts in the direction of the general trend
The longer the market is in a range, the stronger the breakout
Stock making higher lows near resistance zone
(lower highs near support zone is a sign of weakness)
Breakouts in the direction of the general trend
The longer the market is in a range, the stronger the breakout
Stock making higher lows near resistance zone
(lower highs near support zone is a sign of weakness)
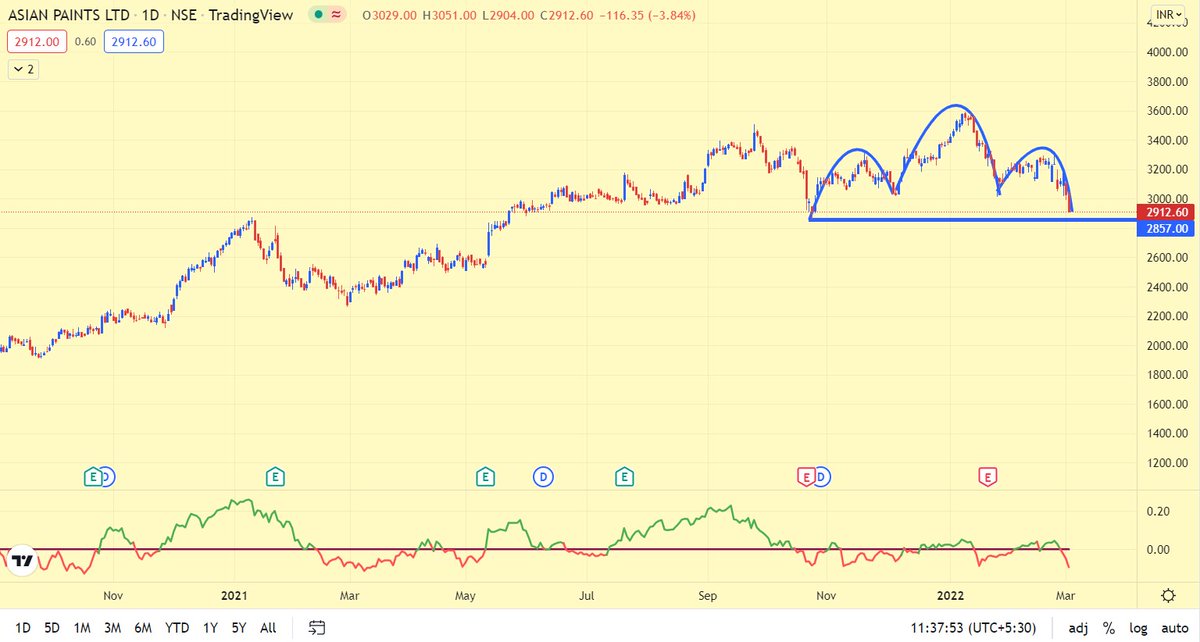
Some ofthe biggest breakouts occur after Volatility Contraction, the analogy is that more a spring is pressed, higher it jumps whenever it gets released.
— Professor (@DillikiBiili) October 2, 2021
There is a VCP Scanner on chartink (Not mine). This may also be used to find potential Breakouts. pic.twitter.com/y1lmay7D4e
Crude Oil forming bottom at US$ 100 for now, which is a big psychological level.
Needs to break below this level for real impact. https://t.co/r5KoExzFKc
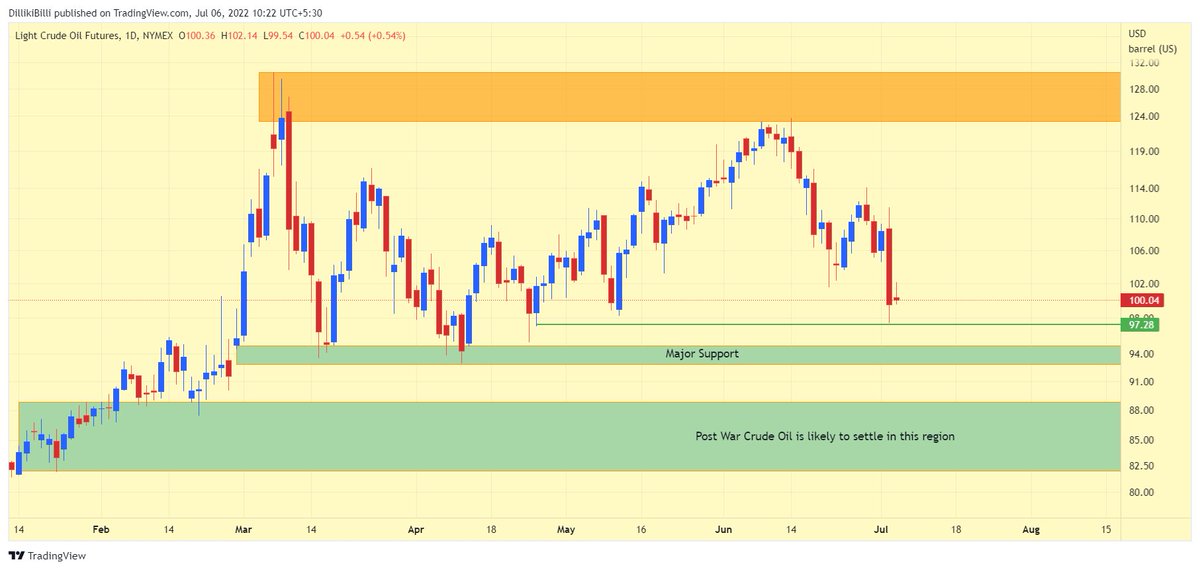
Needs to break below this level for real impact. https://t.co/r5KoExzFKc
NYMEX Crude Oil update !
— Professor (@DillikiBiili) July 1, 2022
Its not ready to come below US$ 100 which is a big psychological level ! Everytime it comes near that zone, it takes a bounce. https://t.co/xQ3dZZXNiu pic.twitter.com/7WS38JU6JF
Jab tak ki meri book nahi aati, ye kar lo:
1. Go through Zerodha Varsity chapters on Technical Analysis at least 2 times.
2. Then read 'Technical Analysis Explained' by Martin Pring
3. Finally read 'Price Action bar by bar' by Al Books (Not for casual reader).
1. Go through Zerodha Varsity chapters on Technical Analysis at least 2 times.
2. Then read 'Technical Analysis Explained' by Martin Pring
3. Finally read 'Price Action bar by bar' by Al Books (Not for casual reader).
Sir @DillikiBiili , could you please suggest a book for technical analysis ?
— Pawan Yadav (@pawan_yadav86) March 25, 2022
You May Also Like



A brief analysis and comparison of the CSS for Twitter's PWA vs Twitter's legacy desktop website. The difference is dramatic and I'll touch on some reasons why.
Legacy site *downloads* ~630 KB CSS per theme and writing direction.
6,769 rules
9,252 selectors
16.7k declarations
3,370 unique declarations
44 media queries
36 unique colors
50 unique background colors
46 unique font sizes
39 unique z-indices
https://t.co/qyl4Bt1i5x

PWA *incrementally generates* ~30 KB CSS that handles all themes and writing directions.
735 rules
740 selectors
757 declarations
730 unique declarations
0 media queries
11 unique colors
32 unique background colors
15 unique font sizes
7 unique z-indices
https://t.co/w7oNG5KUkJ

The legacy site's CSS is what happens when hundreds of people directly write CSS over many years. Specificity wars, redundancy, a house of cards that can't be fixed. The result is extremely inefficient and error-prone styling that punishes users and developers.
The PWA's CSS is generated on-demand by a JS framework that manages styles and outputs "atomic CSS". The framework can enforce strict constraints and perform optimisations, which is why the CSS is so much smaller and safer. Style conflicts and unbounded CSS growth are avoided.
Legacy site *downloads* ~630 KB CSS per theme and writing direction.
6,769 rules
9,252 selectors
16.7k declarations
3,370 unique declarations
44 media queries
36 unique colors
50 unique background colors
46 unique font sizes
39 unique z-indices
https://t.co/qyl4Bt1i5x
PWA *incrementally generates* ~30 KB CSS that handles all themes and writing directions.
735 rules
740 selectors
757 declarations
730 unique declarations
0 media queries
11 unique colors
32 unique background colors
15 unique font sizes
7 unique z-indices
https://t.co/w7oNG5KUkJ
The legacy site's CSS is what happens when hundreds of people directly write CSS over many years. Specificity wars, redundancy, a house of cards that can't be fixed. The result is extremely inefficient and error-prone styling that punishes users and developers.
The PWA's CSS is generated on-demand by a JS framework that manages styles and outputs "atomic CSS". The framework can enforce strict constraints and perform optimisations, which is why the CSS is so much smaller and safer. Style conflicts and unbounded CSS growth are avoided.