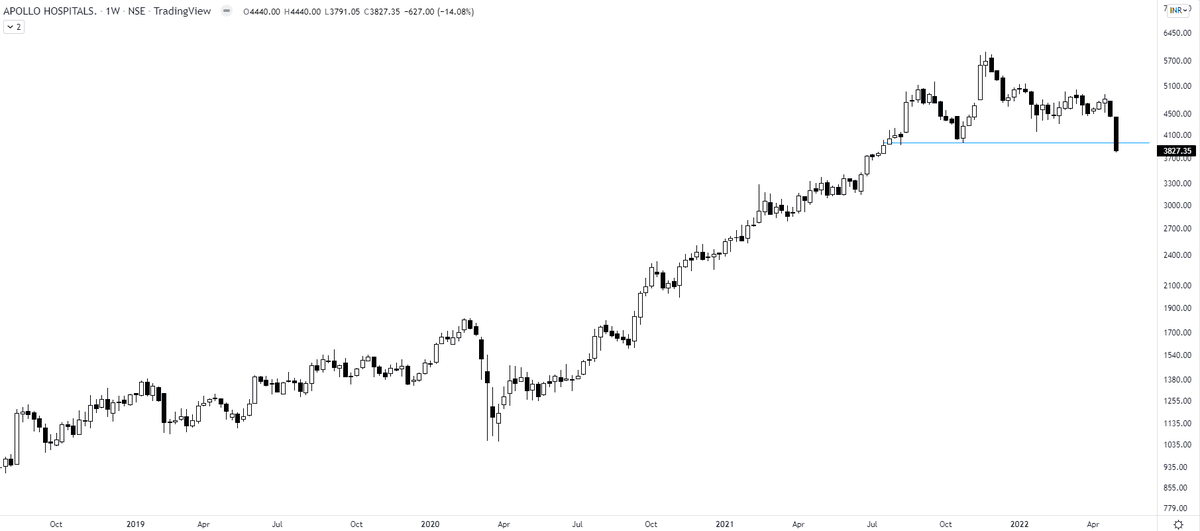
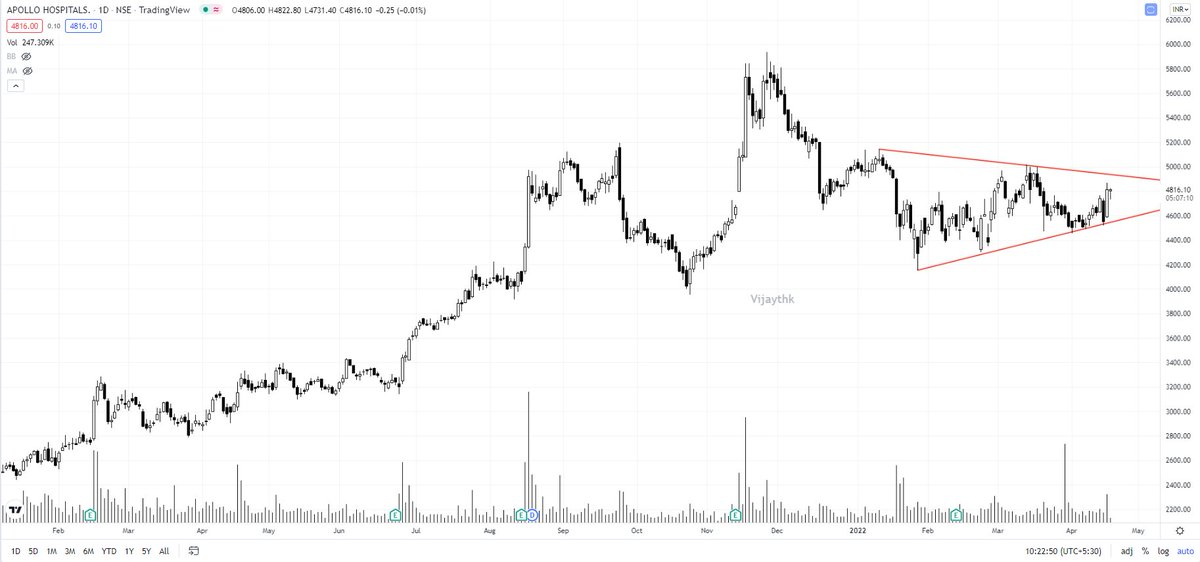
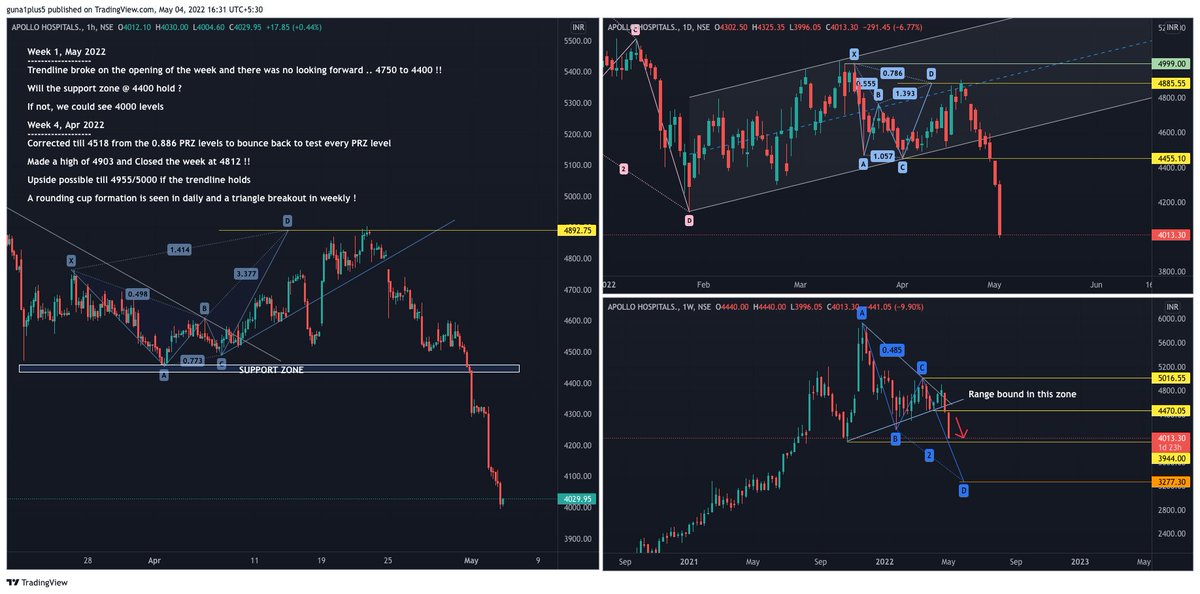
Apollo Hospitals and a clear breakdown. Although the signal came much earlier with a false breakout. Now is the second best exit.
More from The_Chartist 📈
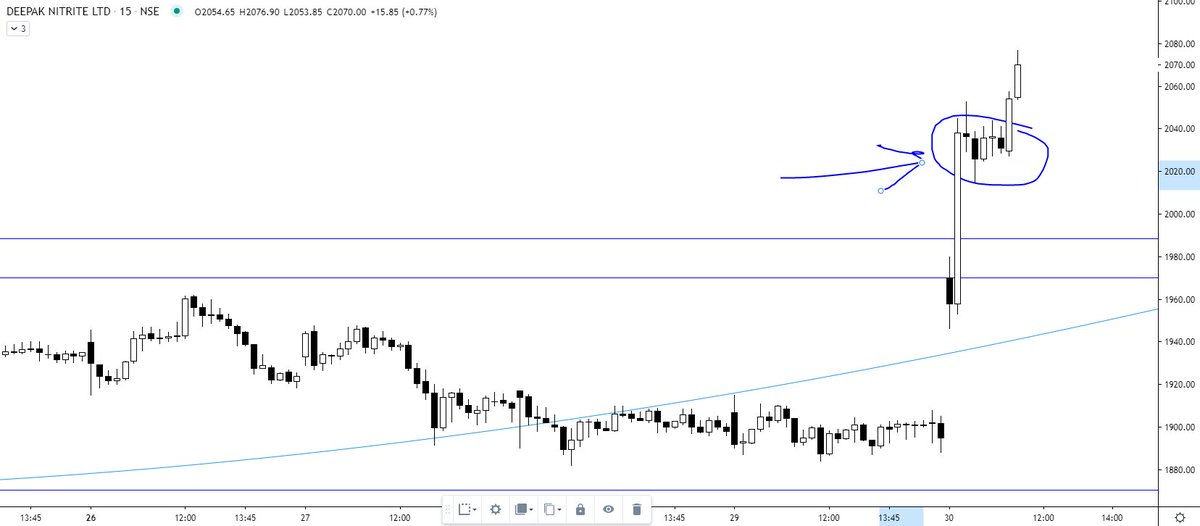
Explained you same concept with Elxsi. The real test of a strong Breakout is that the big hand will not give you another chance to buy the share at the breakout level. They will absorb all the selling of weak hands. I mean "STRONG breakout". https://t.co/7fxFqGQl3p
Tata Elxsi ---
— Steve Nison (@nison_steve) June 30, 2021
In the last 10 minutes, all the selling was absorbed despite intraday positions being squared off (if not converted). will wait for the EOD data. However, the chart structure is extremely strong. https://t.co/pci7GCDBEO pic.twitter.com/1NBD9V3mKc
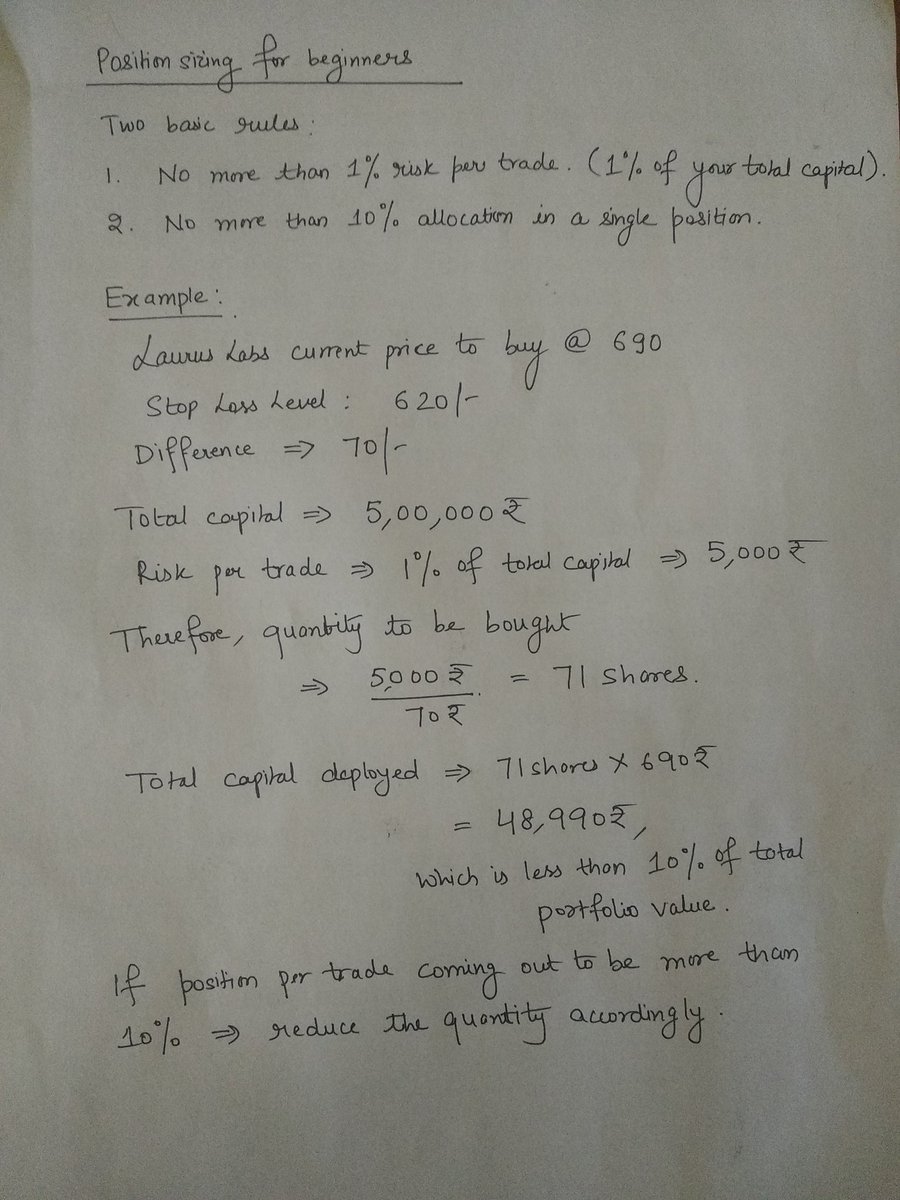

This exercise will tell you about your inherent strengths & weaknesses. 👇👇
How to record a trading journal (TJ) & what to analyze?
— The_Chartist \U0001f4c8 (@charts_zone) December 14, 2021
What is in a TJ?
Buy Date
Stock Name
The time frame you analyzed (D/W/M)
Long/Short?
Buy Price
SL
Sell Price
Risk took (% of capital)
Sell date
No. of days held
P/L
P/L as % of capital
Buy Reason?
Invested capital/trade pic.twitter.com/WnrvmYuOV0
More from Apollohospitals





As per traditional chart analysis, the breakout from the flag can extend by a distance of the flagpole which gives us the price objective of 5850 or thereabouts.
Let's see what happens!
#ApolloHospital https://t.co/jHgjR2WThe
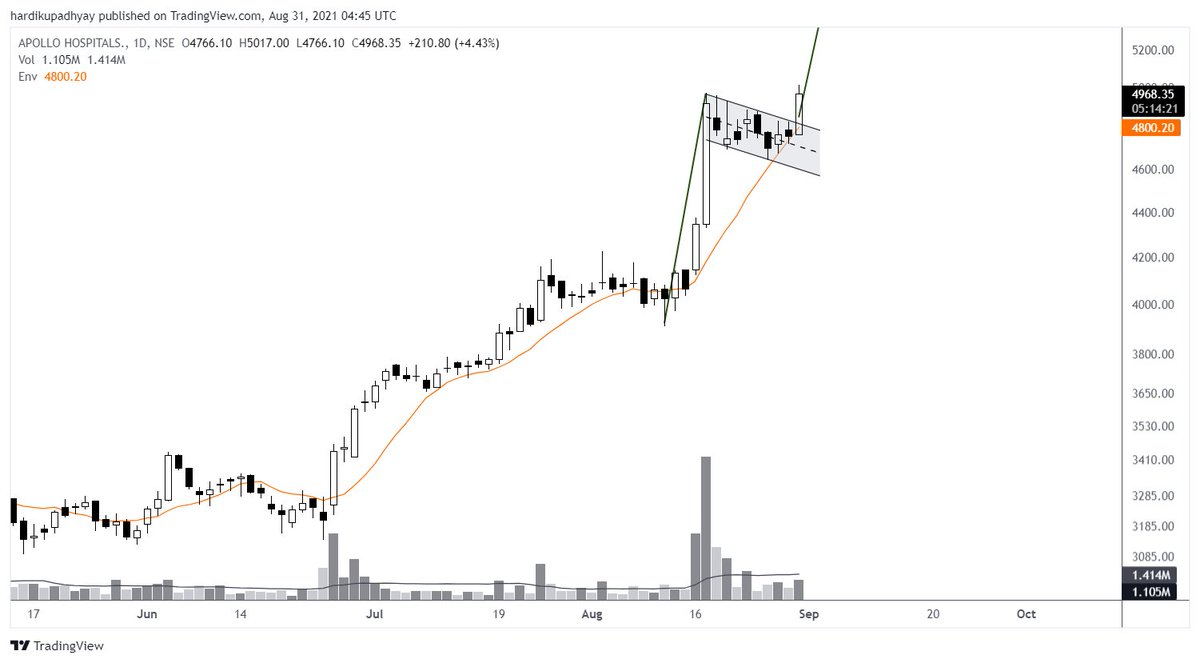
Looks like a Flag to me...
— Hardik Upadhyay, CMT. (@tradingwithdyr) August 30, 2021
A flag pattern is a continuation pattern that suggests a short-term consolidation in opposite direction preceding a strong move.
A breakout above 4850 could have a rapid movement!#ApolloHospitals pic.twitter.com/q7g4enQjRY