
Here are key takeaways from the book 👇👇
Knowledge sharing initiative Book 4: "The interpretation of financial statements" by Benjamin Graham.
This book was published around 1937 by investing legend Ben Graham. Ben is also regarded as the guy under whom the great Warren Buffett started his investing journey.
Here are key takeaways from the book 👇👇
2.Assets=Tangible (PP&E, inventories, accounts receivable, cash)+intangible Assets (trademark, lease rights, goodwill)
4.Tangible assets are written down through depreciation & intangibles are written down through amortization or impairment
6. Depletion gets applied in commodity businesses like cement, mining, and crude oil.
As they inflated their asset value leading to inflated book value, which was later written off as one-time charges against earnings/profit
8.True value of a company’s assets may be different from the B/s total
10. It is not so essential to invest only in cos. with dominant size, as countless e.g of smaller cos. prospering more than larger ones can be seen in the mkts
High ratio indicates-co. will easily meet short-term obligations
14.Working capital(WC)=current assets–current liabilities
WC makes it easier for a co. to run daily operations & meet emergency needs without taking new financing
15. Quick Ratio = (Current Assets – Inventory)/Current Liabilities
Inventory turnover can be compared on a year-to-year basis. Measures how efficiently the company turns inventories into profits.
18.Valuing companies on book value is majorly applied in banks, insurance cos, & holding companies
23. Net Current Asset Value (NCAV)=Current assets–liabilities & preferred stock.
25. Earning Power of a company = Expected earnings in the future
26. We take current & past earnings as a guide to predict future earnings.
28.Investing requires a balance between facts of the past and possibilities of the future
a) How certain am I that this favorable trend will continue,&
b) How large a price am I paying in advance for the expected continuance of the trend?”
Credits @FinnacleAcademy
Here is the book link: https://t.co/fjfj11MKLf
More from Investment Books


More from Trading


You May Also Like

I hate when I learn something new (to me) & stunning about the Jeff Epstein network (h/t MoodyKnowsNada.)
Where to begin?
So our new Secretary of State Anthony Blinken's stepfather, Samuel Pisar, was "longtime lawyer and confidant of...Robert Maxwell," Ghislaine Maxwell's Dad.
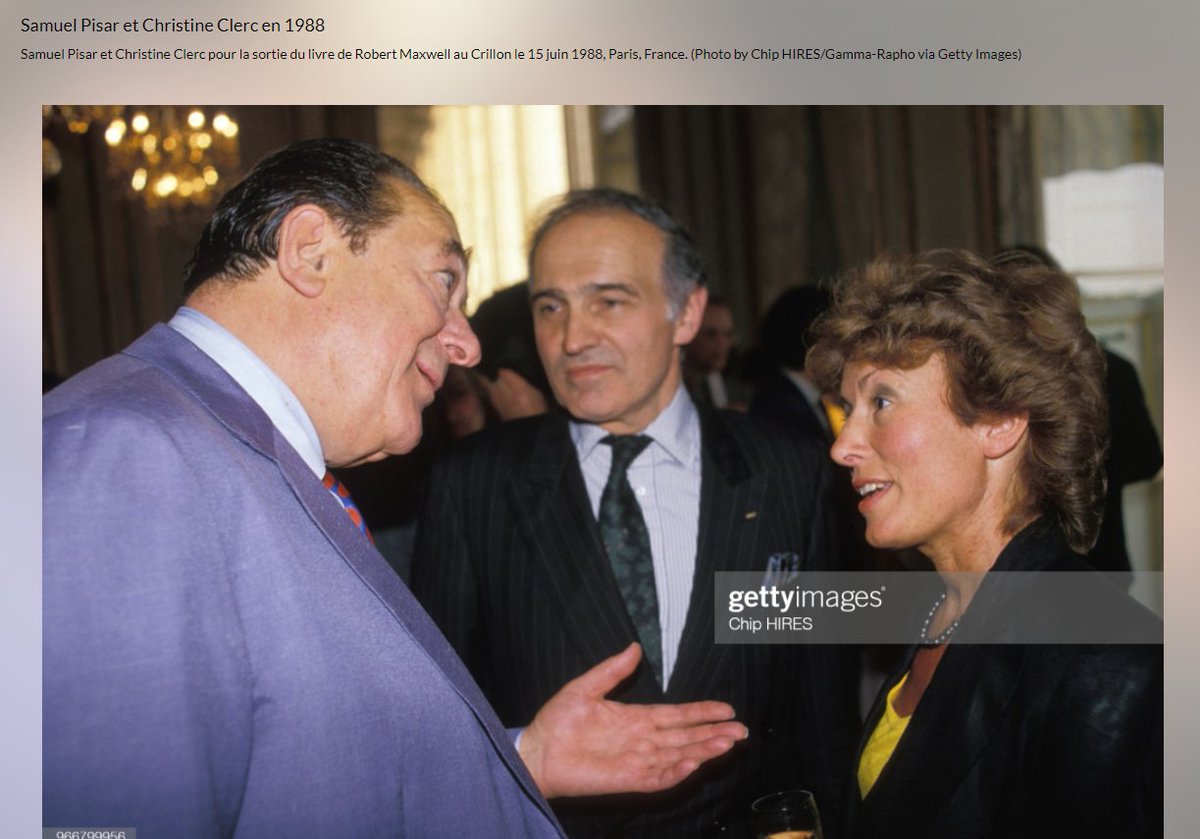
"Pisar was one of the last people to speak to Maxwell, by phone, probably an hour before the chairman of Mirror Group Newspapers fell off his luxury yacht the Lady Ghislaine on 5 November, 1991." https://t.co/DAEgchNyTP

OK, so that's just a coincidence. Moving on, Anthony Blinken "attended the prestigious Dalton School in New York City"...wait, what? https://t.co/DnE6AvHmJg
Dalton School...Dalton School...rings a
Oh that's right.
The dad of the U.S. Attorney General under both George W. Bush & Donald Trump, William Barr, was headmaster of the Dalton School.
Donald Barr was also quite a
I'm not going to even mention that Blinken's stepdad Sam Pisar's name was in Epstein's "black book."
Lots of names in that book. I mean, for example, Cuomo, Trump, Clinton, Prince Andrew, Bill Cosby, Woody Allen - all in that book, and their reputations are spotless.
Where to begin?
So our new Secretary of State Anthony Blinken's stepfather, Samuel Pisar, was "longtime lawyer and confidant of...Robert Maxwell," Ghislaine Maxwell's Dad.
"Pisar was one of the last people to speak to Maxwell, by phone, probably an hour before the chairman of Mirror Group Newspapers fell off his luxury yacht the Lady Ghislaine on 5 November, 1991." https://t.co/DAEgchNyTP
OK, so that's just a coincidence. Moving on, Anthony Blinken "attended the prestigious Dalton School in New York City"...wait, what? https://t.co/DnE6AvHmJg
Dalton School...Dalton School...rings a
Oh that's right.
The dad of the U.S. Attorney General under both George W. Bush & Donald Trump, William Barr, was headmaster of the Dalton School.
Donald Barr was also quite a
Donald Barr had a way with words. pic.twitter.com/JdRBwXPhJn
— Rudy Havenstein, listening to Nas all day. (@RudyHavenstein) September 17, 2020
I'm not going to even mention that Blinken's stepdad Sam Pisar's name was in Epstein's "black book."
Lots of names in that book. I mean, for example, Cuomo, Trump, Clinton, Prince Andrew, Bill Cosby, Woody Allen - all in that book, and their reputations are spotless.

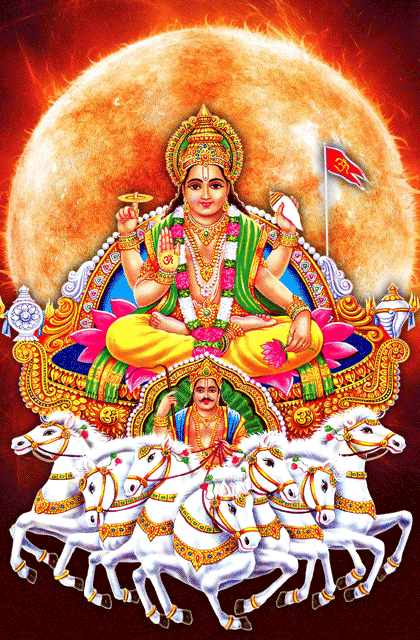
#ஆதித்தியஹ்ருதயம் ஸ்தோத்திரம்
இது சூரிய குலத்தில் உதித்த இராமபிரானுக்கு தமிழ் முனிவர் அகத்தியர் உபதேசித்ததாக வால்மீகி இராமாயணத்தில் வருகிறது. ஆதித்ய ஹ்ருதயத்தைத் தினமும் ஓதினால் பெரும் பயன் பெறலாம் என மகான்களும் ஞானிகளும் காலம் காலமாகக் கூறி வருகின்றனர். ராம-ராவண யுத்தத்தை
தேவர்களுடன் சேர்ந்து பார்க்க வந்திருந்த அகத்தியர், அப்போது போரினால் களைத்து, கவலையுடன் காணப்பட்ட ராமபிரானை அணுகி, மனிதர்களிலேயே சிறந்தவனான ராமா போரில் எந்த மந்திரத்தைப் பாராயணம் செய்தால் எல்லா பகைவர்களையும் வெல்ல முடியுமோ அந்த ரகசிய மந்திரத்தை, வேதத்தில் சொல்லப்பட்டுள்ளதை உனக்கு
நான் உபதேசிக்கிறேன், கேள் என்று கூறி உபதேசித்தார். முதல் இரு சுலோகங்கள் சூழ்நிலையை விவரிக்கின்றன. மூன்றாவது சுலோகம் அகத்தியர் இராமபிரானை விளித்துக் கூறுவதாக அமைந்திருக்கிறது. நான்காவது சுலோகம் முதல் முப்பதாம் சுலோகம் வரை ஆதித்ய ஹ்ருதயம் என்னும் நூல். முப்பத்தி ஒன்றாம் சுலோகம்
இந்தத் துதியால் மகிழ்ந்த சூரியன் இராமனை வாழ்த்துவதைக் கூறுவதாக அமைந்திருக்கிறது.
ஐந்தாவது ஸ்லோகம்:
ஸர்வ மங்கள் மாங்கல்யம் ஸர்வ பாப ப்ரநாசனம்
சிந்தா சோக ப்ரசமனம் ஆயுர் வர்த்தனம் உத்தமம்
பொருள்: இந்த அதித்ய ஹ்ருதயம் என்ற துதி மங்களங்களில் சிறந்தது, பாவங்களையும் கவலைகளையும்
குழப்பங்களையும் நீக்குவது, வாழ்நாளை நீட்டிப்பது, மிகவும் சிறந்தது. இதயத்தில் வசிக்கும் பகவானுடைய அனுக்ரகத்தை அளிப்பதாகும்.
முழு ஸ்லோக லிங்க் பொருளுடன் இங்கே உள்ளது https://t.co/Q3qm1TfPmk
சூரியன் உலக இயக்கத்திற்கு மிக முக்கியமானவர். சூரிய சக்தியால்தான் ஜீவராசிகள், பயிர்கள்


"I really want to break into Product Management"
make products.
"If only someone would tell me how I can get a startup to notice me."
Make Products.
"I guess it's impossible and I'll never break into the industry."
MAKE PRODUCTS.
Courtesy of @edbrisson's wonderful thread on breaking into comics – https://t.co/TgNblNSCBj – here is why the same applies to Product Management, too.
There is no better way of learning the craft of product, or proving your potential to employers, than just doing it.
You do not need anybody's permission. We don't have diplomas, nor doctorates. We can barely agree on a single standard of what a Product Manager is supposed to do.
But – there is at least one blindingly obvious industry consensus – a Product Manager makes Products.
And they don't need to be kept at the exact right temperature, given endless resource, or carefully protected in order to do this.
They find their own way.
make products.
"If only someone would tell me how I can get a startup to notice me."
Make Products.
"I guess it's impossible and I'll never break into the industry."
MAKE PRODUCTS.
Courtesy of @edbrisson's wonderful thread on breaking into comics – https://t.co/TgNblNSCBj – here is why the same applies to Product Management, too.
"I really want to break into comics"
— Ed Brisson (@edbrisson) December 4, 2018
make comics.
"If only someone would tell me how I can get an editor to notice me."
Make Comics.
"I guess it's impossible and I'll never break into the industry."
MAKE COMICS.
There is no better way of learning the craft of product, or proving your potential to employers, than just doing it.
You do not need anybody's permission. We don't have diplomas, nor doctorates. We can barely agree on a single standard of what a Product Manager is supposed to do.
But – there is at least one blindingly obvious industry consensus – a Product Manager makes Products.
And they don't need to be kept at the exact right temperature, given endless resource, or carefully protected in order to do this.
They find their own way.