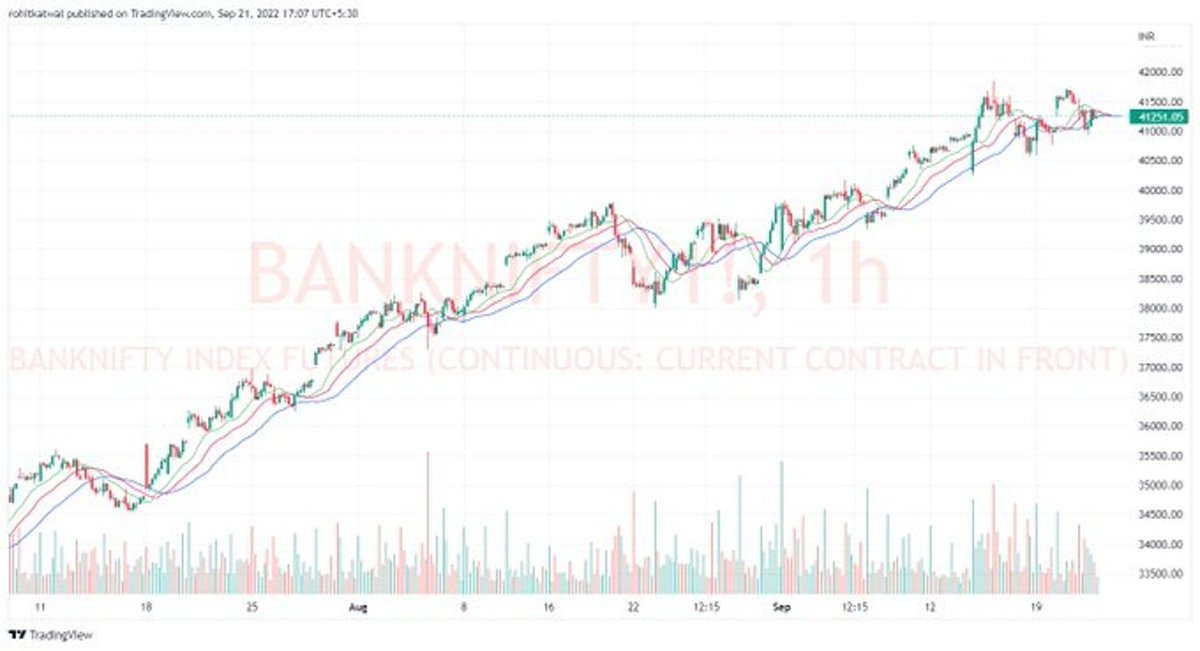
William's Alligator is probably the most underrated indicator in moving average category.

Alligator follows the premise that market is sideways for 70% of the time and trending only 30% of the time.

This is where William's Alligator can be a great tool for traders.

Why William's Alligator can be a great tool for traders?

It can identify Bullish, Bearish and Sideways market pretty easily. Problem is, traders don't know how to use it effectively. Alligator has three lines:

1. Lips - Fastest Line
2. Teeth
3. Jaws - Slowest Line
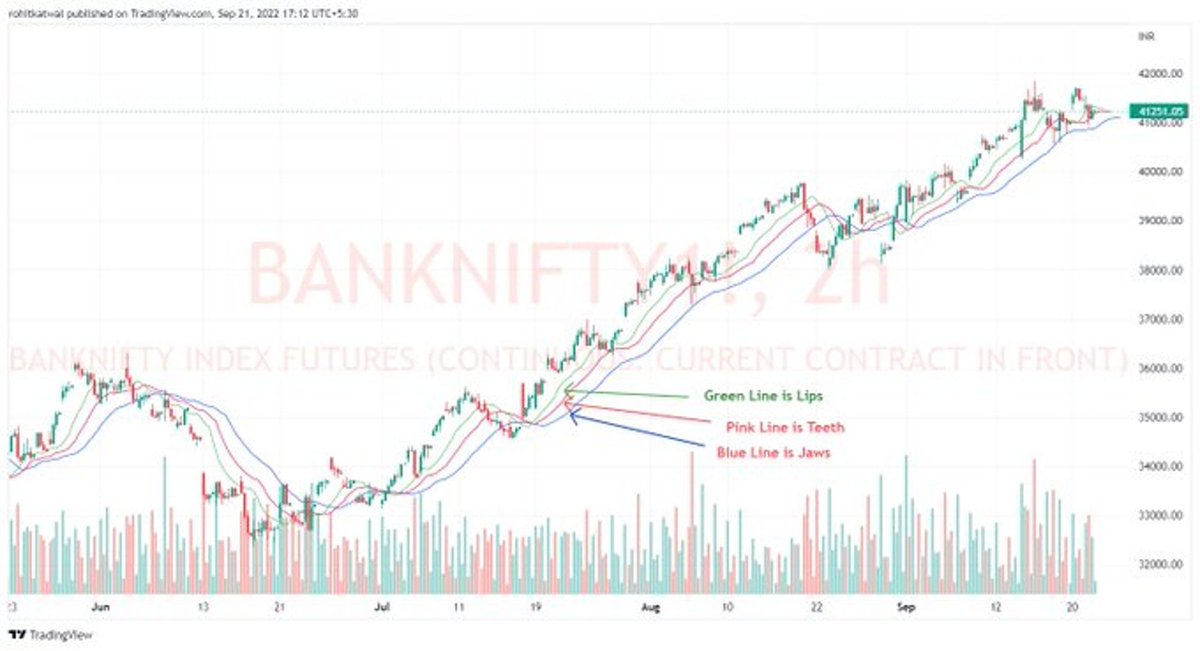
Book Interpretation is when Lips Crosses above Jaws, it's a buying opportunity and when below its a shorting opportunity. And when three lines are crisscrossing, instrument is sideways.

BUT this does not make it a tradeable indicator in practice. Here is what should be done.
Firstly, when all the Alligator lines are moving up or down and are widening, this phase is called "Alligator eating with its mouth wide open". When the lines are crisscrossing, this indicates the alligator is sated.

Now, how to use it? with Basic TA and Indicator like MACD
Rules to remember:
1. As long as price is above Alligator, BANKNIFTY is bullish.
2. As long as MACD is trading above 0 line, BANKNIFTY is bullish.
3. Horizontal Lines are the only S&R.
4. CONGESTION is followed by TREND is followed by CONGESTION.
5. In an uptrend, Lips act as support and & sell area.

Bearish Alligator
1. MACD < Signal Line < 0 Line
2. Candle High < Alligator Lips (total body of candle outside alligator)

Trend Change
1. Candle Close > Alligator Jaws
In attached Image
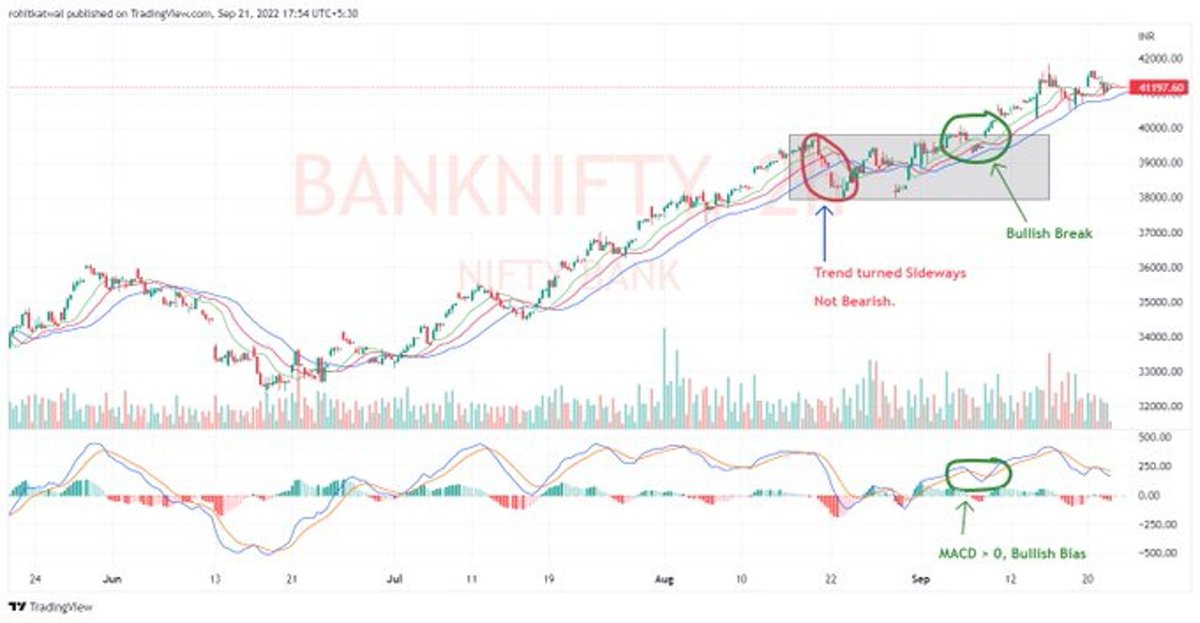
1. Trend was bearish.
2. Candle Closed > Alligator Jaws = Trend Changing

According to TA, once trend is finished, price enters into congestion / sideways zone. Bullish / Bearish break depends upon break from this zone.

Rectangle here denotes congestion.
Bullish Alligator
1. Candle Low > Alligator Lips
2. MACD > Signal Line > 0

In this image as price is moving up, candle is completely above and outside Alligator Lips, with MACD > Signal Line > 0 line denoting trend changing to bullish.

Note - Horizontal breaks are important.
--Important thing to understand here is MACD. Till the time MACD is above 0 Line, bias is bullish.

--Even if price occasionally tries to change trend to downside on Alligator, as long as MACD > 0, bias is sideways bullish.

See how price went below alligator but MACD did not.
--Incidentally, MACD and Alligator turned bullish.

--Broke the resistance R1 and R2 i.e. a horizontal line at previous high.

--Notice the Alligator hunting to upper side with mouth open.

--Price taking support exactly at Alligator Lips.

--Price > Lips and MACD > 0 = Bullish
--This pattern of Bullish/Bearish followed by Trend Change is market fundamental which is true for most of the timeframes and instruments.

--Accumulation/Distribution followed by a trend followed by Accumulation/Distribution

-- Trend turned sideways and bullish breakout.

More from Trading

FREE MINI STOCK MBA
If you wish to learn abt trading,psychology,options,business etc
You can go through this thread.
Other than this I do post videos on my YT channel : -Abhishek Kar & Tradiostation
-Intraday views on FREE telegram : Abhishek Kar Official
RT will be appreciated

1. Threads to learn Options
https://t.co/wabkek43I8

2. https://t.co/OIDenHKdWN

3. Some core rules to investing
https://t.co/37d1pygp7P

4.Summing up 2020 Trading lessons
https://t.co/jSUb1lSGbQ

5.Effects of margin change on


6. Exciting story about a trader who destroyed a Bank
https://t.co/CsEEhIsD3q

7. Some Thought Provoking facts about stock markets
https://t.co/IjxpX5Wx24

8. A dose on Trading and investing


9. Top 5 resources to learn everything about stocks
https://t.co/6KnIySBGIG

10. Some Pro Tips on Trading
https://t.co/EiSGikt7jv

11. Wisdom on stuffs you should not do
https://t.co/bI2dH0XTSS

12. Reasons why you are losing the


13. The DARK side of stock market
https://t.co/qsteGcbquI

14. Stocks where you should NOT invest
https://t.co/2tD5q0K3UQ

15. Lessons from MILLIONAIRE trader
https://t.co/Pec6LmUtGa

16. Lessons from my

You May Also Like

Trading view scanner process -

1 - open trading view in your browser and select stock scanner in left corner down side .

2 - touch the percentage% gain change ( and u can see higest gainer of today)


3. Then, start with 6% gainer to 20% gainer and look charts of everyone in daily Timeframe . (For fno selection u can choose 1% to 4% )

4. Then manually select the stocks which are going to give all time high BO or 52 high BO or already given.

5. U can also select those stocks which are going to give range breakout or already given range BO

6 . If in 15 min chart📊 any stock sustaing near BO zone or after BO then select it on your watchlist

7 . Now next day if any stock show momentum u can take trade in it with RM

This looks very easy & simple but,

U will amazed to see it's result if you follow proper risk management.

I did 4x my capital by trading in only momentum stocks.

I will keep sharing such learning thread 🧵 for you 🙏💞🙏

Keep learning / keep sharing 🙏
@AdityaTodmal