
Before we discuss the indicator, let us understand an important concept.
Thread: Alligator indicator
#Alligator #Indicators #Definedge

Before we discuss the indicator, let us understand an important concept.
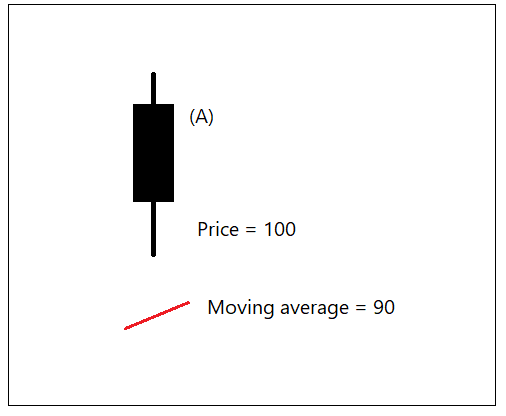
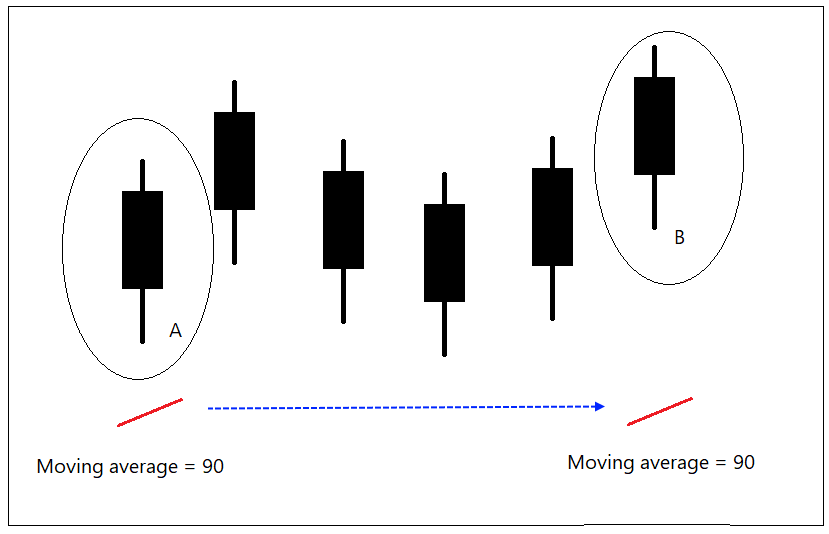
Moving average at bar B is moving average price of bar A (5 candles behind). This is shifting of moving average price. What does it mean?
https://t.co/WkNxKU9n8u
Let us discuss the Alligator indicator.
Thread:- How Ichimoku indicator is calculated. pic.twitter.com/pM7AZvJjMj
— Prashant Shah (@Prashantshah267) April 15, 2020
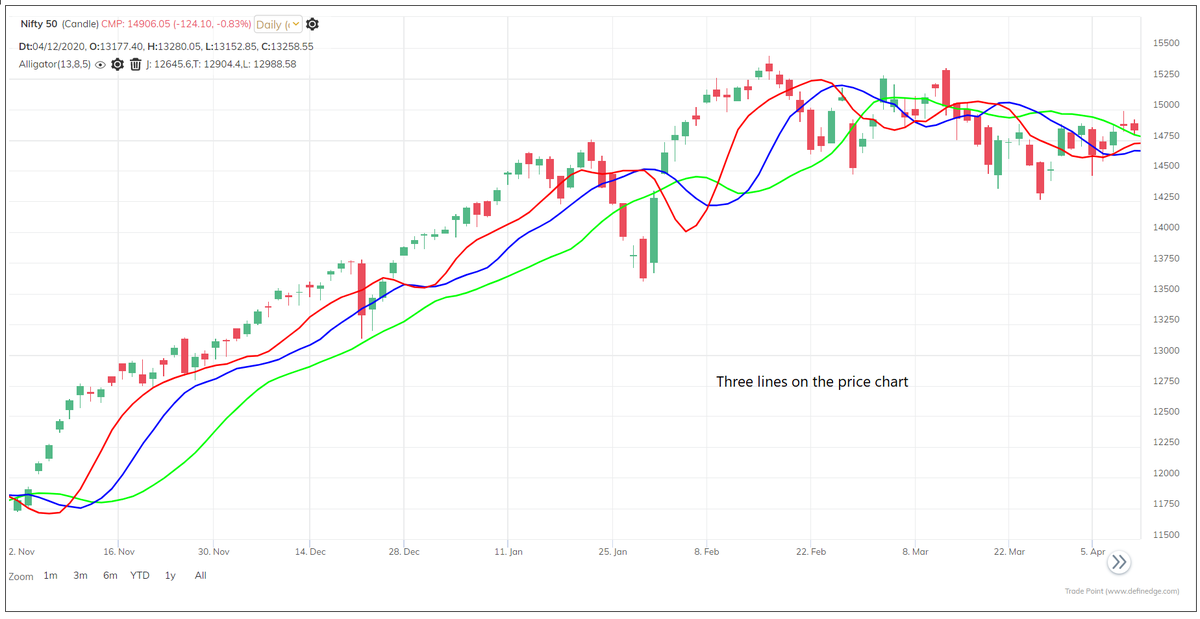
Williams suggested Fib numbers 13, 8 and 5 period averages.
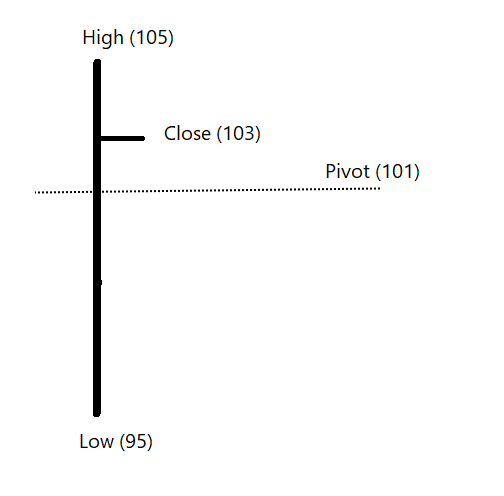
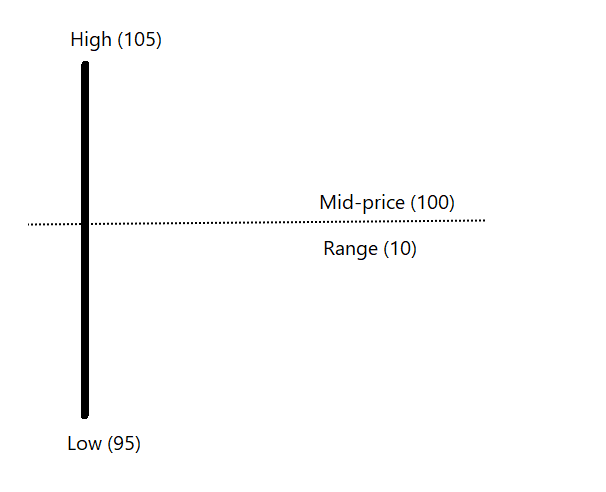
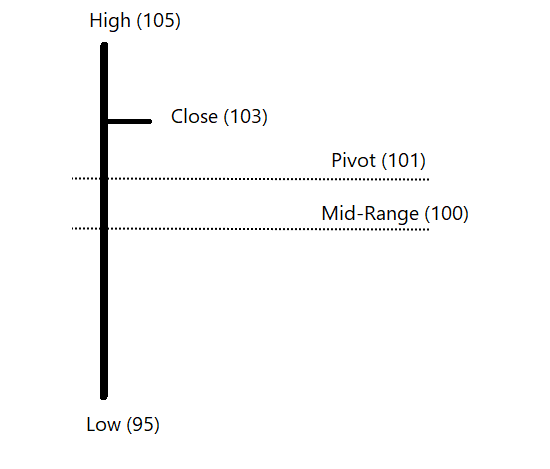
The averages are calculated on median price.
Median price = (High + low) / 2.
So, there are three lines plotted on the chart.
13-period MA is shifted by 8 bars
8-period MA is shifted by 5 bars
5-period MA is shifted by 3 bars
So, default parameters of Alligator indicator are 13,8,5 and 8,5,3.
The 13-period MA to 8 (13,8) is called as Alligator’s Jaws.
8-period MA to 5, the Teeth and
5-period MA to 3, the Lips.
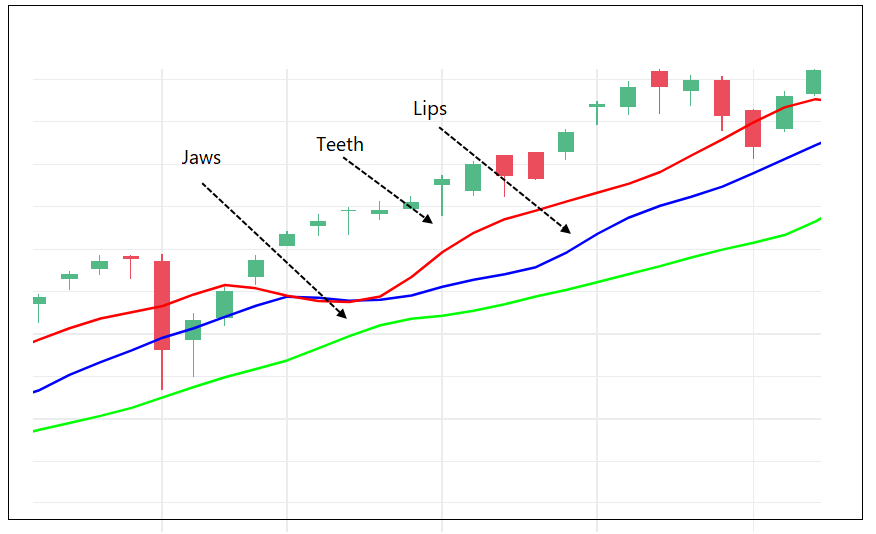
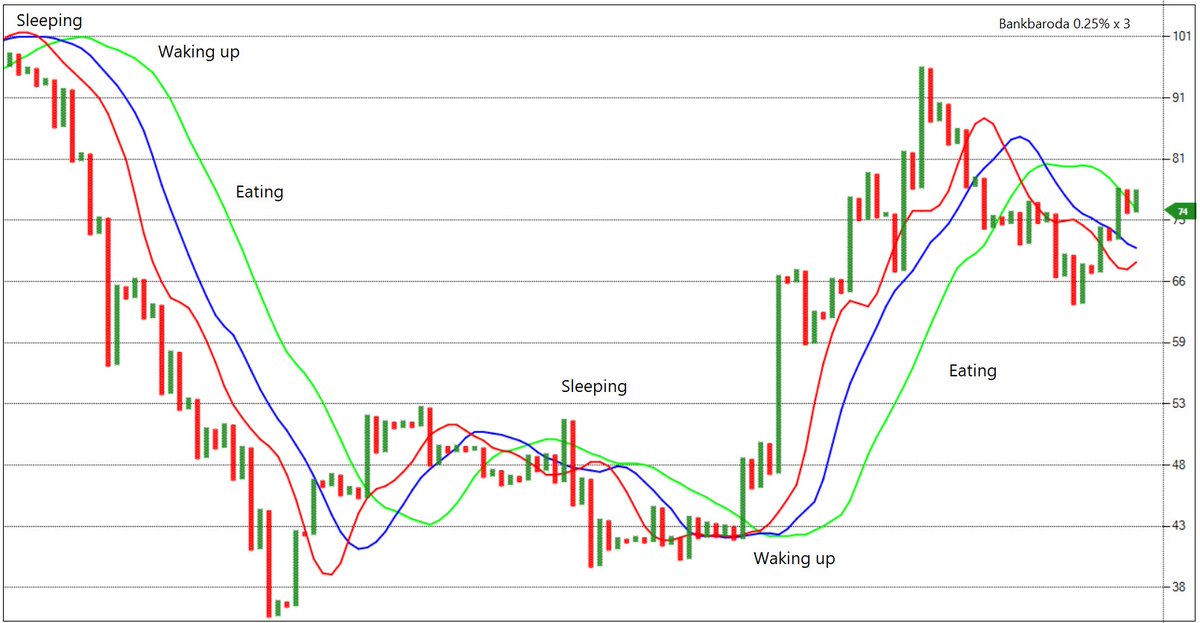
When three lines are close to each other, the Alligator is sleeping.
If the Lips crosses the Teeth and Jaws upward or downward, the Alligator is waking up.
If Price crosses above or below the three lines, the Alligator is eating.
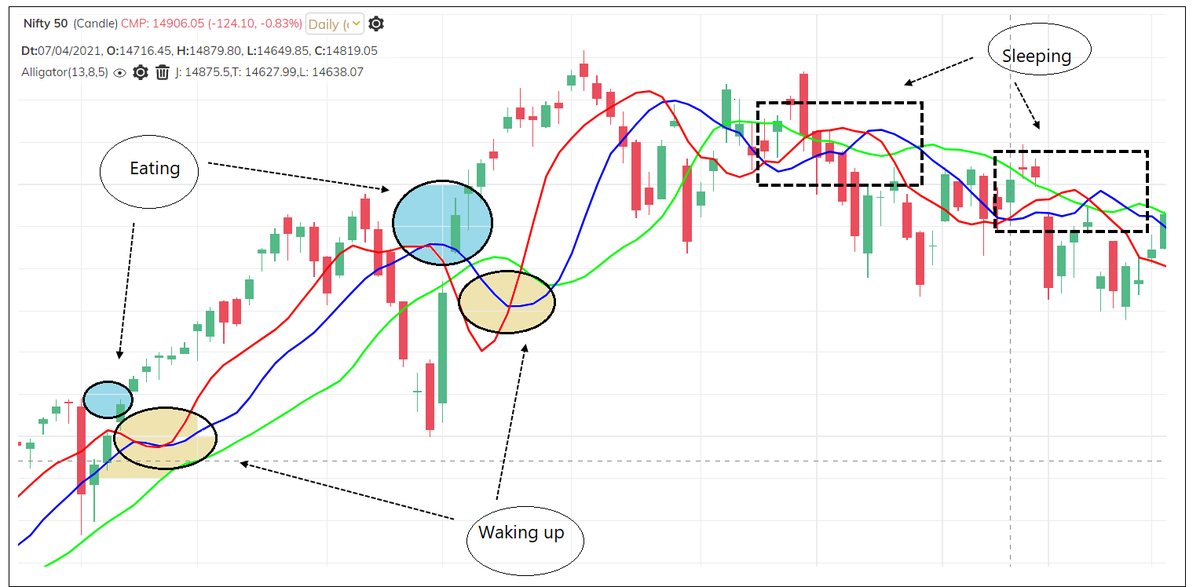
When three lines are close to each other, there is no clear trend.
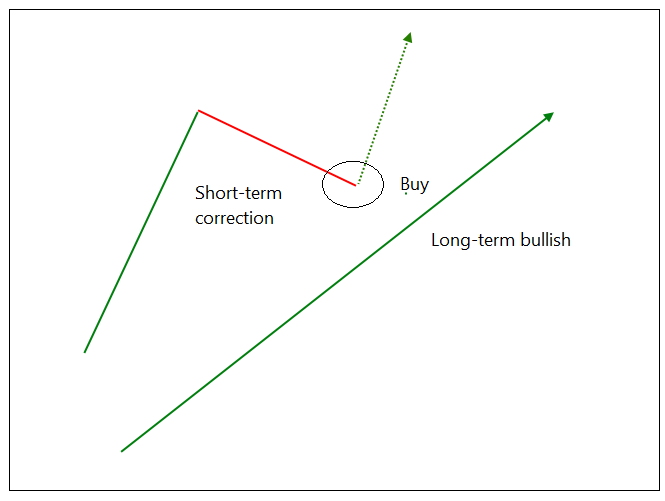
When short-term average crosses other two upward or downward, the trend might emerge.
When three lines are trending, and price is above them, then it indicates strong uptrend.
Over a period, market trends roughly 20% – 30% times, it remains in a range rest of the time.
If Alligator sleeps more (long consolidation), it will become hungrier and eat more (Strong trend).
There are two important observations on this indicator which I found useful:
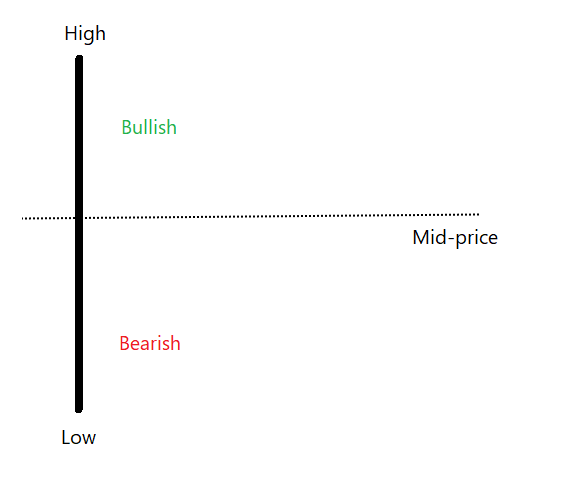
2 – Price low is above three averages and all averages are rising = Strong up trend. Price high is below averages and all averages are falling = strong downtrend.
These readings are also possible using other indicators and charts. Idea was to talk about the concept.

More from Prashant Shah


More from Stockslearnings


This is so useful. Thank you @heartwon 🙏
On this auspicious day of #GuruPoornima2020
— \u03b1\u043c\u03b9\u0442\u0442 \u0455\u03b1\u03b9\u03b7\u03b9 \U0001f1ee\U0001f1f3 (@heartwon) July 5, 2020
Would like to present a simple yet effective way of understanding and following the TREND of the instrument/stock.
Q: Why I came up with the concept?
A: I wanted to remove noise, keep my chart simple where just a glance, tells the story
You May Also Like


Facebook originally a CIA program called "LifeLog".
LifeLog, via DARPA, terminated on Feb 4th, 2004.
Facebook was launched on Feb 4th, 2004.
Many of the LifeLog team became execs at FB.
Zuckerberg is a figurehead.
CIA allowed Cambridge to help Trump win
https://t.co/enzOXDCogV

Pentagon Kills LifeLog
LifeLog, via DARPA, terminated on Feb 4th, 2004.
Facebook was launched on Feb 4th, 2004.
Many of the LifeLog team became execs at FB.
Zuckerberg is a figurehead.
CIA allowed Cambridge to help Trump win
https://t.co/enzOXDCogV
Project: Lifelog
— Robert Horan (@Robby12692) December 13, 2018
Started by DARPA in 1999, the goal of Lifelog was to create a database on civilians without their knowledge, and track everything they do.
The project "ended" on Feb 4th, 2004.
Facebook began the exact same day.
The CIA funneled tens of millions into Facebook. pic.twitter.com/r7hwF0v9kh
Pentagon Kills LifeLog

To people who are under the impression that you can get rich quickly by working on an app, here are the stats for https://t.co/az8F12pf02
📈 ~12000 vistis
☑️ 109 transactions
💰 353€ profit (285 after tax)
I have spent 1.5 months on this app. You can make more $ in 2 days.
🤷♂️

I'm still happy that I launched a paid app bcs it involved extra work:
- backend for processing payments (+ permissions, webhooks, etc)
- integration with payment processor
- UI for license activation in Electron
- machine activation limit
- autoupdates
- mailgun emails
etc.
These things seemed super scary at first. I always thought it was way too much work and something would break. But I'm glad I persisted. So far the only problem I have is that mailgun is not delivering the license keys to certain domains like https://t.co/6Bqn0FUYXo etc. 👌
omg I just realized that me . com is an Apple domain, of course something wouldn't work with these dicks
📈 ~12000 vistis
☑️ 109 transactions
💰 353€ profit (285 after tax)
I have spent 1.5 months on this app. You can make more $ in 2 days.
🤷♂️
I'm still happy that I launched a paid app bcs it involved extra work:
- backend for processing payments (+ permissions, webhooks, etc)
- integration with payment processor
- UI for license activation in Electron
- machine activation limit
- autoupdates
- mailgun emails
etc.
These things seemed super scary at first. I always thought it was way too much work and something would break. But I'm glad I persisted. So far the only problem I have is that mailgun is not delivering the license keys to certain domains like https://t.co/6Bqn0FUYXo etc. 👌
omg I just realized that me . com is an Apple domain, of course something wouldn't work with these dicks

