#FreeTip
#Intraday
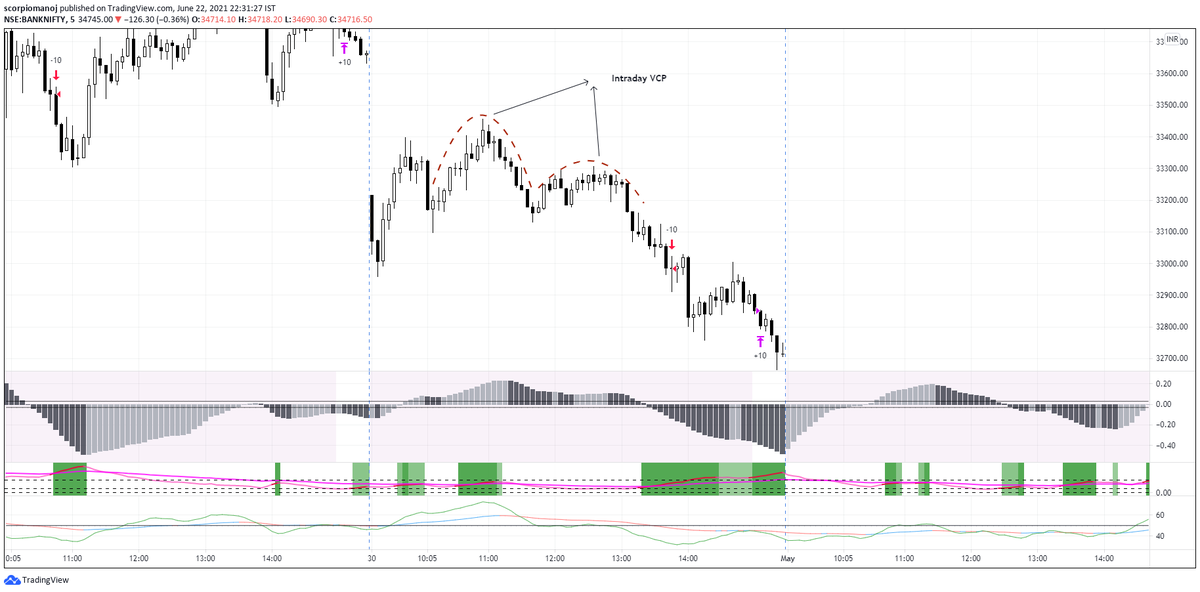
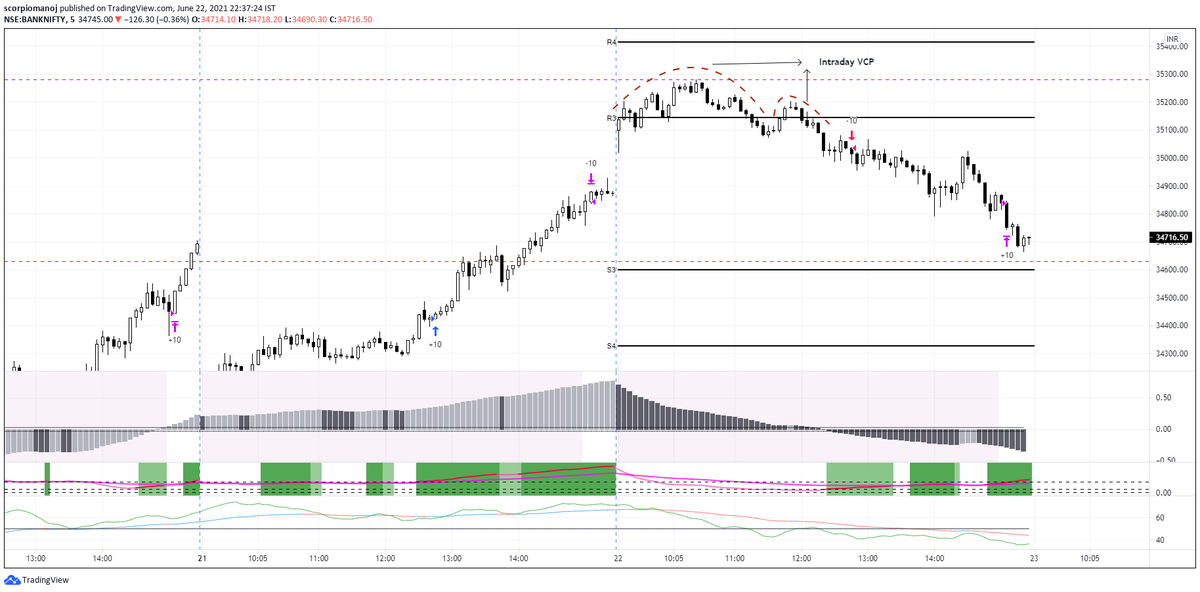
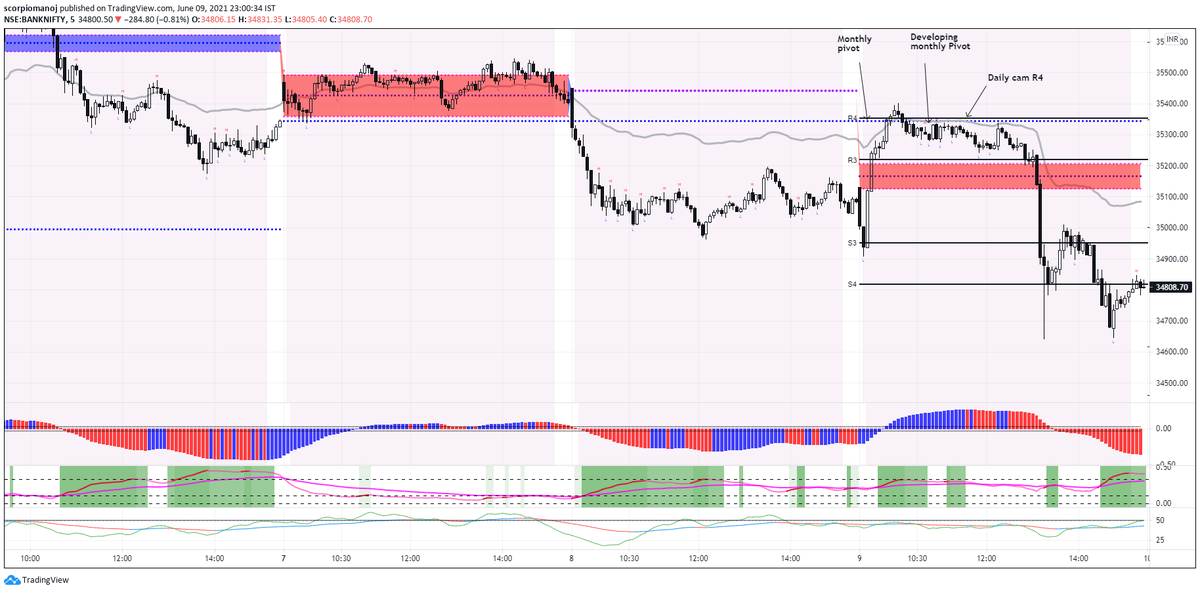
An intraday pattern that usually results in a big move; Doesn't occur very frequently; If it happens, most of the time the move is big.
Intraday VCP. - U shaped Higher lows (2-5) for an upmove (usually without HHs). n shaped LHs for downmove (usually w.o. LLs
More from HMK alias MANOJ
More from Stockslearnings

Read and retweet. One of thr best investors in India who has made multibaggers from various sectors such as seeds, Financials, Auto Ancs, Real estate, Chemicals, Pharma,Technical textiles, Animal health etc. Uniquest and most realistic+diverse approach in my view @SamitVartak
Compelled to take down notes from this very interesting talk by @SamitVartak and share with the Investing community. Was introduced to this gentleman by @ishmohit1 - Thanks !!https://t.co/bCfjfNBWO1
— Mouzam (@mmali09) July 18, 2021
Highly recommended to watch it.
\u267b\ufe0fRetweet to if you find my notes useful https://t.co/3zZ9qCf90z pic.twitter.com/LGjoJDaJsT




1/n
Dear @chartmojo
Out of curiosity, just gone through your timeline and prepared a data of your shared tweets in OCT'2020;
You will not believe the following numbers:
Charts shared = 29 (2 excluded due to splits)
Period = 8-oct to 30-oct'20
..
2/n
If min.10k invested on your each design, then
Amount invested in Oct'20 = 2.91 lacs
Present investment value = 4.72 lacs
Maximum drawdown = 9%
ROI = 62% in 200 days
Annualized ROI = 147%
**You ROCK brother**
...
I've prepared a sheet for all your Oct'20 tweets; It was so much learning on the charts as well as on the data-part; Please keep on the good work.
Sheet link:
https://t.co/8BJtMsOkBD
With regards,
Deepak
Dear @chartmojo
Out of curiosity, just gone through your timeline and prepared a data of your shared tweets in OCT'2020;
You will not believe the following numbers:
Charts shared = 29 (2 excluded due to splits)
Period = 8-oct to 30-oct'20
..
2/n
If min.10k invested on your each design, then
Amount invested in Oct'20 = 2.91 lacs
Present investment value = 4.72 lacs
Maximum drawdown = 9%
ROI = 62% in 200 days
Annualized ROI = 147%
**You ROCK brother**
...
I've prepared a sheet for all your Oct'20 tweets; It was so much learning on the charts as well as on the data-part; Please keep on the good work.
Sheet link:
https://t.co/8BJtMsOkBD
With regards,
Deepak


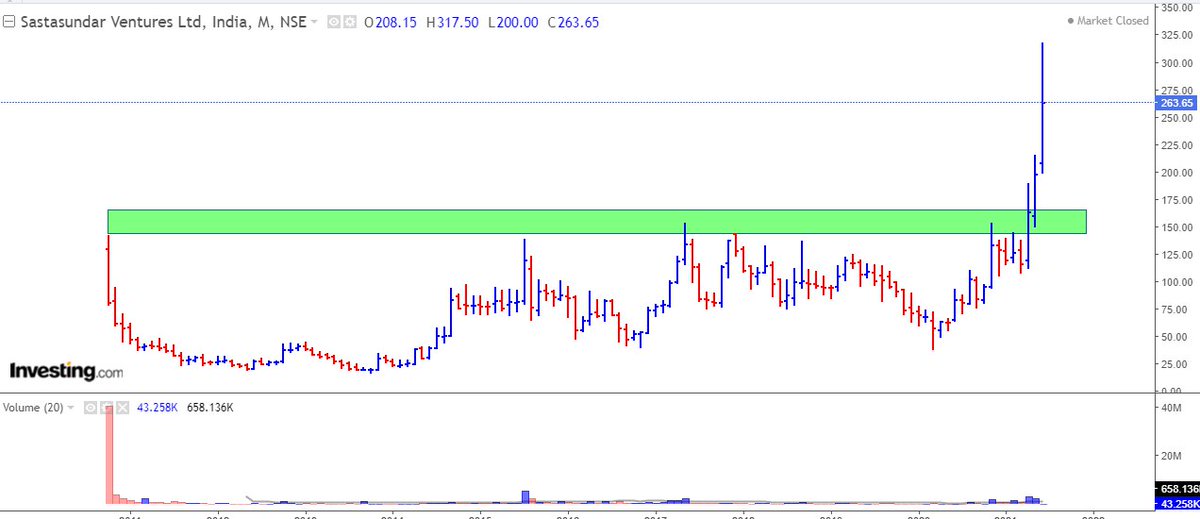
🌟Lesson 1 - weekly /monthly breakout push stock price 30/50% higher in 2/3 weeks.
Ex- #sastasundar after breakout 145/155 zone , stocks in 2/3 weeks given 30/40% return.
And in 2/3 months it was double 💞 https://t.co/9kkc3IV4Lo
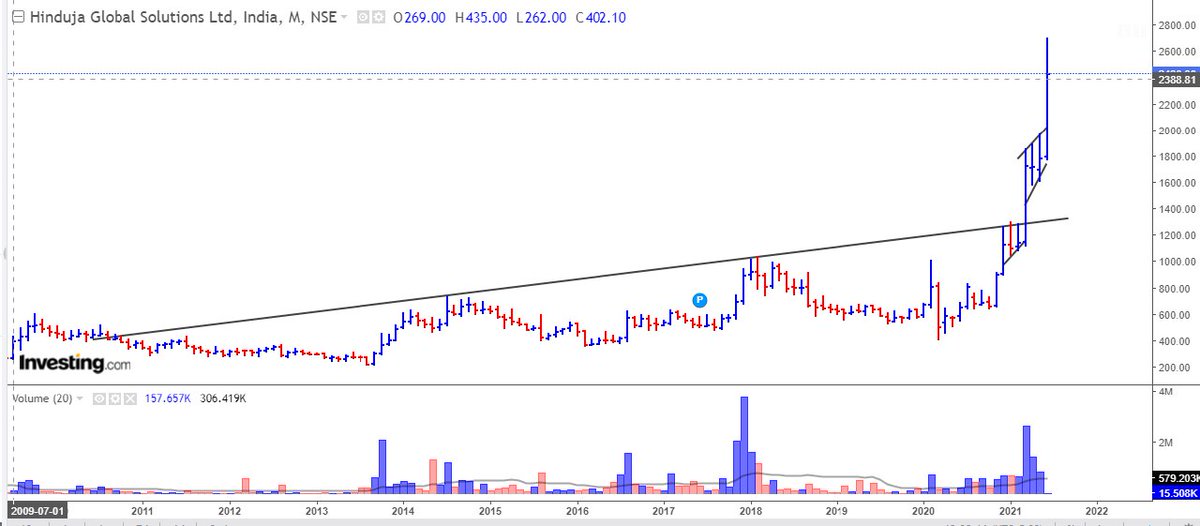
🌟Lesson 2 - if stock is making same pattern ( in 2 /3hours chart) after given breakout of (weekly /monthly chart) , then chances of stock going up is much more.
Ex - #HGS after given breakout of Trendline ( range) in monthly chart, again making same pattern 4 hours chart. 💞
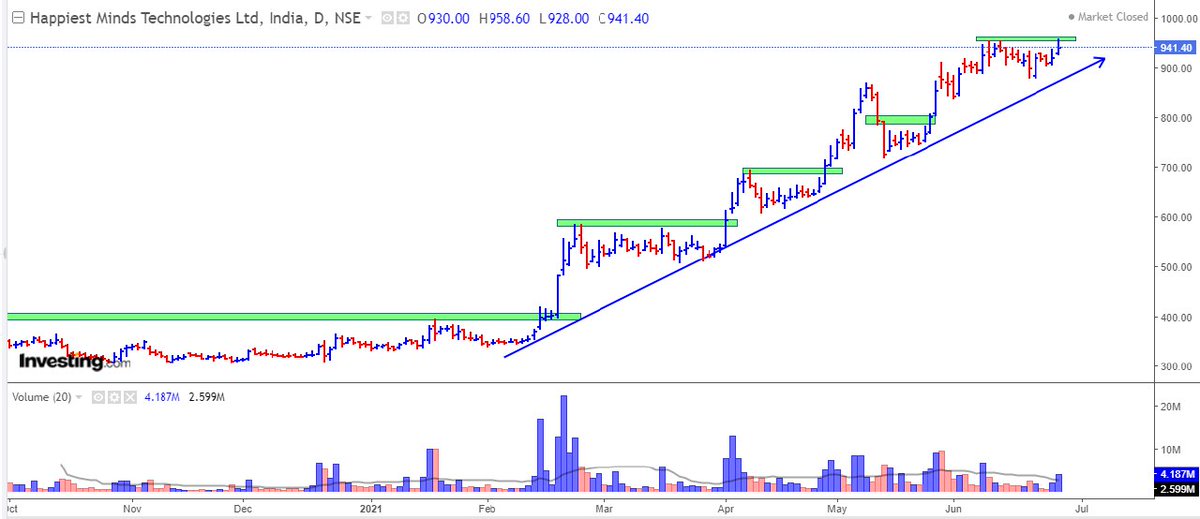
🌟Lesson 3- if stock never come to retest it's weekly & monthly breakout zone then the chances of it's 2x is much more.
EX - #happiestmind everytime consolidating & making new high. 💞
@chartmojo
@charts_breakout
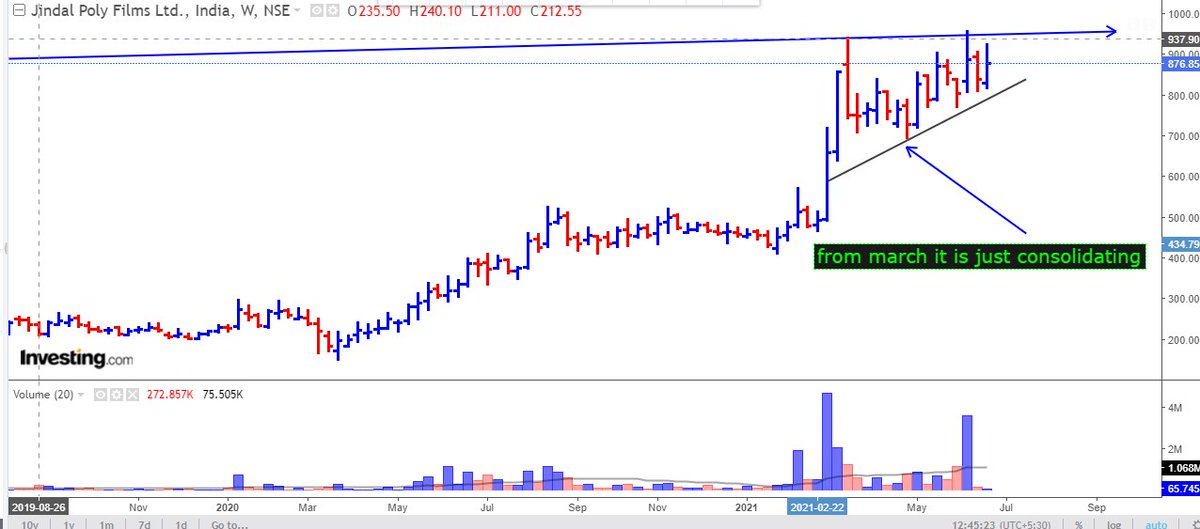
🌟Lesson 4 - when whole market fall still strongest stocks only consolidate or move down very little.
Ex - when this march market took correction 800/1000 points #jindalpoly just consolidating from that time.
Now ready for new high . 💞
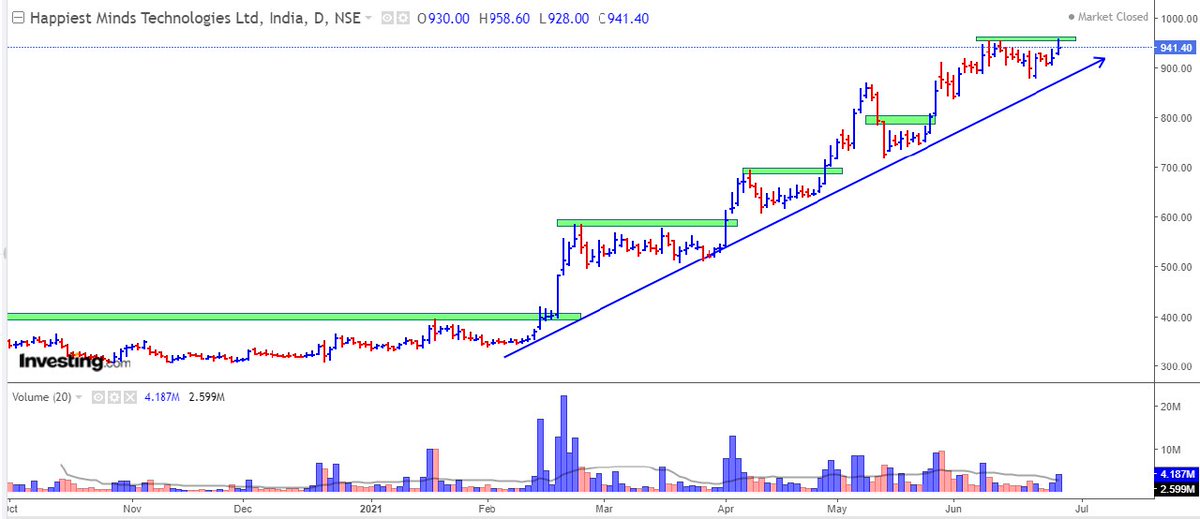
🌟Lesson 5 - when market recover the strongest stocks recover very fast & will make new high.
Ex - #happiestmind when market take little correction & again bounce little , then #happiestmind made new high before market .
Ex- #sastasundar after breakout 145/155 zone , stocks in 2/3 weeks given 30/40% return.
And in 2/3 months it was double 💞 https://t.co/9kkc3IV4Lo
I am going to make #priceaction breakout thread with real examples
— V\xb6k\u03c0nT (@Trading0secrets) June 24, 2021
By which u can easily find out blasting stocks.
it is only based on my experience of last 5 years
How many learners are excited \U0001f973
Show your love \u2764 by likes & retweets so that most new one can take advantage.
🌟Lesson 2 - if stock is making same pattern ( in 2 /3hours chart) after given breakout of (weekly /monthly chart) , then chances of stock going up is much more.
Ex - #HGS after given breakout of Trendline ( range) in monthly chart, again making same pattern 4 hours chart. 💞
🌟Lesson 3- if stock never come to retest it's weekly & monthly breakout zone then the chances of it's 2x is much more.
EX - #happiestmind everytime consolidating & making new high. 💞
@chartmojo
@charts_breakout
🌟Lesson 4 - when whole market fall still strongest stocks only consolidate or move down very little.
Ex - when this march market took correction 800/1000 points #jindalpoly just consolidating from that time.
Now ready for new high . 💞
🌟Lesson 5 - when market recover the strongest stocks recover very fast & will make new high.
Ex - #happiestmind when market take little correction & again bounce little , then #happiestmind made new high before market .