Everything housing is moving now, previously it was mainly the ancillary plays like Pipes, Ceramics, Adhesives and Cement. Now we have the home builders, CGD's, HFC's, MDF, Laminates, Sinks, etc..
The Home Building Theme has just broadened itself and is moving in top gear!
The best ways to play the real estate revival theme instead of buying the home builders :-
— Saket Reddy (@saketreddy) November 21, 2020
1. Ceramics (CERA, KAJARIA)
2. Pipes (ASTRAL, SUPREME, APLAPOLLO)
3. Paints (ASIAN, BERGER)
4. Cement (JKCEM, SHREEC)
5. Construction Chemicals (PIDILITE)
6. Electricals (POLYCAB, HAVELLS)
More from Saket Reddy
While people were debating figuring out which is the best in ICICI/AXIS & INDUSINDBNK, look what the top 3 high quality banks (HDFCBANK, KOTAKBANK & CUB) have done over the last 5, 10 & 17 years.
They are the real compounders, they've created massive wealth compared to others! https://t.co/PluVwU5OXG
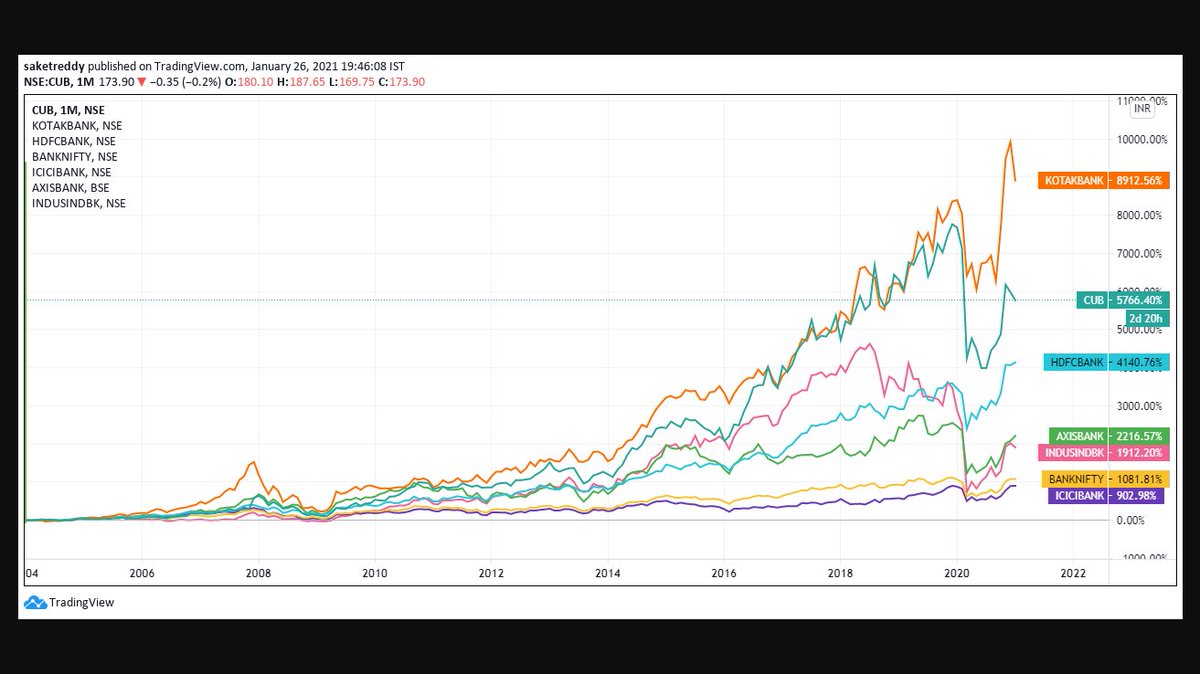
They are the real compounders, they've created massive wealth compared to others! https://t.co/PluVwU5OXG
Hope Everyone saw BANDHANBNK Numbers. I feel many such banks will go through a massive NPA Cycle followed by depleted Tier 1.
— Saket Reddy (@saketreddy) January 24, 2021
Hence, stay with the Top 3 banks :-
HDFCBANK
KOTAKBANK
CUB
They've low cost of funding, well provisioned Moratorium book, high ROEs & high Tier 1 CAR.