FINEORG
Double Top Buy, T20 Pattern - Bullish & Super Pattern - Bullish triggered today on close above 3293.05. https://t.co/JdxFElM03K
FINEORG - FINE ORGANICS https://t.co/8PQNrDCE62 pic.twitter.com/XTuzXg2Qwy
— Saket Reddy (@saketreddy) September 10, 2020
More from Saket Reddy
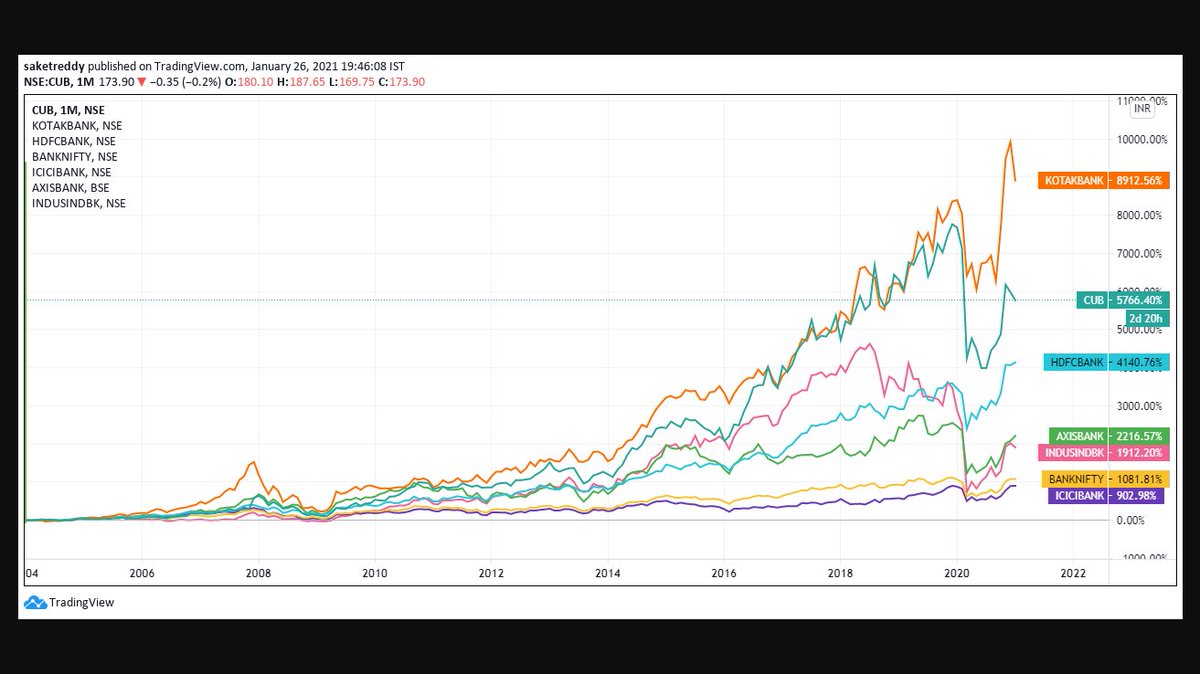
New All Time High for PIIND!
Just stay the course and this superb management with a prudent capital allocation abilities will compound your wealth over the long term!
PIIND
— Saket Reddy (@saketreddy) February 7, 2021
The case for Reinvestment of cash flows through Capex or Diversification into sectors with similar/higher Incremental ROIC & Asset turnover and growth prospects rather than pumping out bulk of the cash through dividends, hence earnings compounding at a much higher rate. pic.twitter.com/KJAhbIc1zv
COFORGE
Double Top Buy above 3426.76 daily close on 1% box size chart. https://t.co/geOoLAc5XU
COFORGE
— Saket Reddy (@saketreddy) May 6, 2021
Triple Top Buy above 3196.21 daily close on 1% Box size chart & Double Top Buy above 3195.68 daily close on 3% Box size chart. https://t.co/RI62IqiBoL pic.twitter.com/jvTNSR7W7P
You May Also Like
1/OK, data mystery time.
This New York Times feature shows China with a Gini Index of less than 30, which would make it more equal than Canada, France, or the Netherlands. https://t.co/g3Sv6DZTDE
That's weird. Income inequality in China is legendary.
Let's check this number.
2/The New York Times cites the World Bank's recent report, "Fair Progress? Economic Mobility across Generations Around the World".
The report is available here:
3/The World Bank report has a graph in which it appears to show the same value for China's Gini - under 0.3.
The graph cites the World Development Indicators as its source for the income inequality data.
4/The World Development Indicators are available at the World Bank's website.
Here's the Gini index: https://t.co/MvylQzpX6A
It looks as if the latest estimate for China's Gini is 42.2.
That estimate is from 2012.
5/A Gini of 42.2 would put China in the same neighborhood as the U.S., whose Gini was estimated at 41 in 2013.
I can't find the <30 number anywhere. The only other estimate in the tables for China is from 2008, when it was estimated at 42.8.