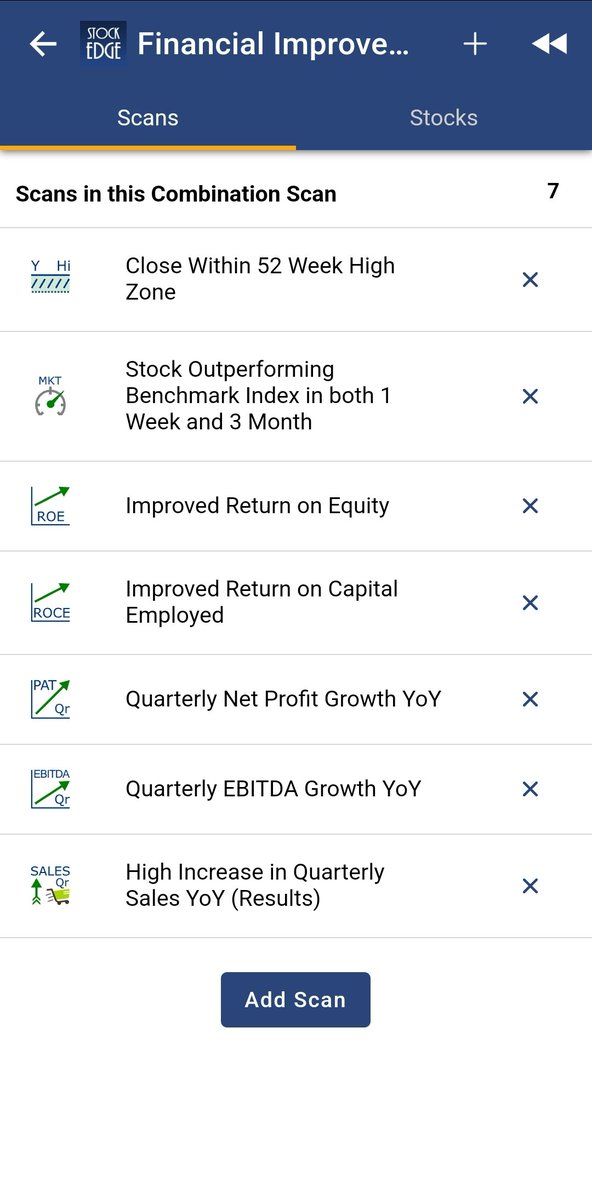
Categories Screeners
7 days
30 days
All time
Recent
Popular


The most important question now on the mind of all analysts and traders. Is this a bear market rally or is this the start of a bull move. Retweeting this as I will need a few tweets to explain my view
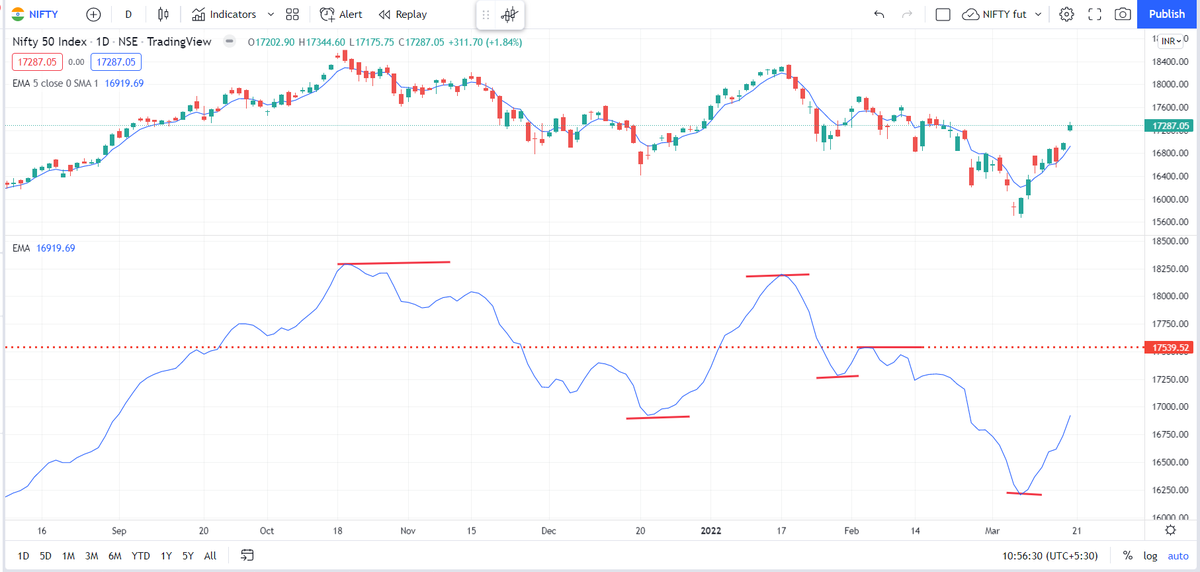
Everyone knows the HH-HL or LH-LL as per Dow theory. This can be a bit confusing on how one marks the Highs and Lows. Long back, I picked up this trick from one of the neo-Dow theorists on what to do in scenarios like this
Simply plot a 5 period exponential moving average on a different panel. A 5-EMA simply shows you a running weekly perspective and kind of smoothens the price where a single spike high/low is not of that much importance
You will see this 5-ema also making HH.HL.LH.LL. So now, rather than focusing on the highs/lows on the charts, focusing on highs/lows on the 5-ema gives a cleaner perspective
As per this charts, unless the 5-ema now closes above 17540 ( the ema, not Nifty price) I will not play this as a bull market. I will deal with this market as a counter move against the major bear trend
Is Nifty bullish, or bearish?
— AP (@ap_pune) March 19, 2022
Replies MUST be ONLY with charts, not just 'views', no Russia Ukraine, crude, gold etc.
Can be levels....abv/below
Just technicals....maybe with trend lines, indicators or any other study (EW, harmonics etc)
Charts can be daily, weekly or monthly.
Everyone knows the HH-HL or LH-LL as per Dow theory. This can be a bit confusing on how one marks the Highs and Lows. Long back, I picked up this trick from one of the neo-Dow theorists on what to do in scenarios like this
Simply plot a 5 period exponential moving average on a different panel. A 5-EMA simply shows you a running weekly perspective and kind of smoothens the price where a single spike high/low is not of that much importance
You will see this 5-ema also making HH.HL.LH.LL. So now, rather than focusing on the highs/lows on the charts, focusing on highs/lows on the 5-ema gives a cleaner perspective
As per this charts, unless the 5-ema now closes above 17540 ( the ema, not Nifty price) I will not play this as a bull market. I will deal with this market as a counter move against the major bear trend

#FREETIPS
For new followers ...
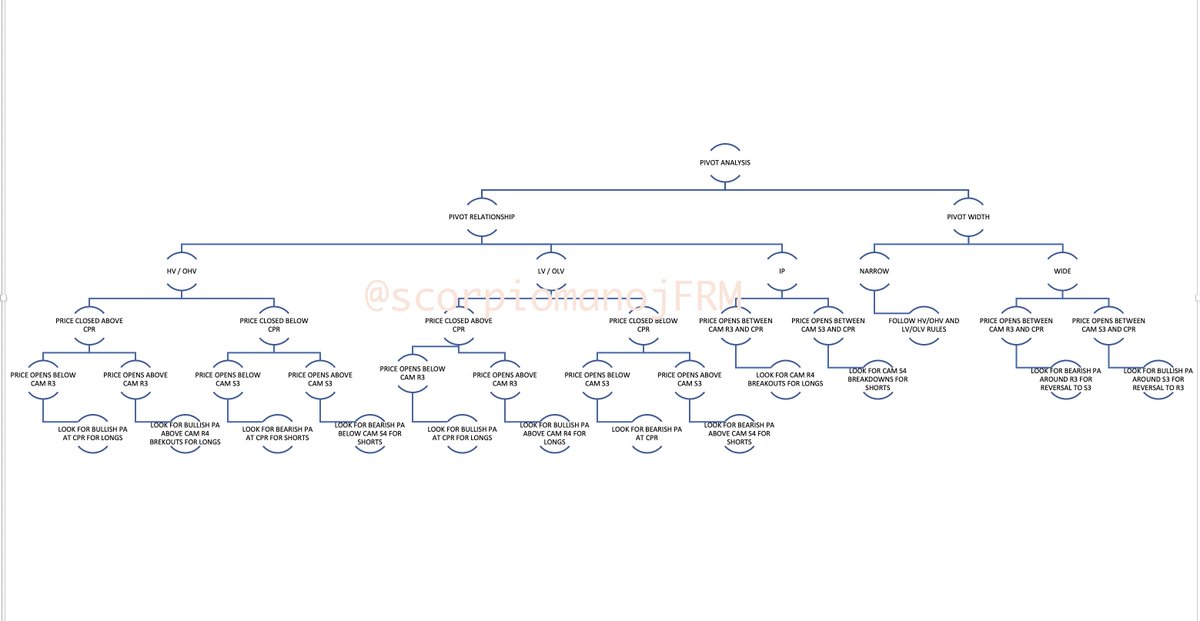
If u r a pivot based intraday trader, u should have this cheat sheet. Follow this and C. Your wrong trades will reduce considerably. Good luck.
For new followers ...
If u r a pivot based intraday trader, u should have this cheat sheet. Follow this and C. Your wrong trades will reduce considerably. Good luck.
#FREETIPS
— ScorpioManoj (@scorpiomanojFRM) April 1, 2022
Pivot Rules snapshot
A free one page cheat sheet for pivot based trading that could probably be sold for a hefty price ....
Rem: This is just a broad set of rules. There are many advance rules more than this. pic.twitter.com/FnzmGGKx0P
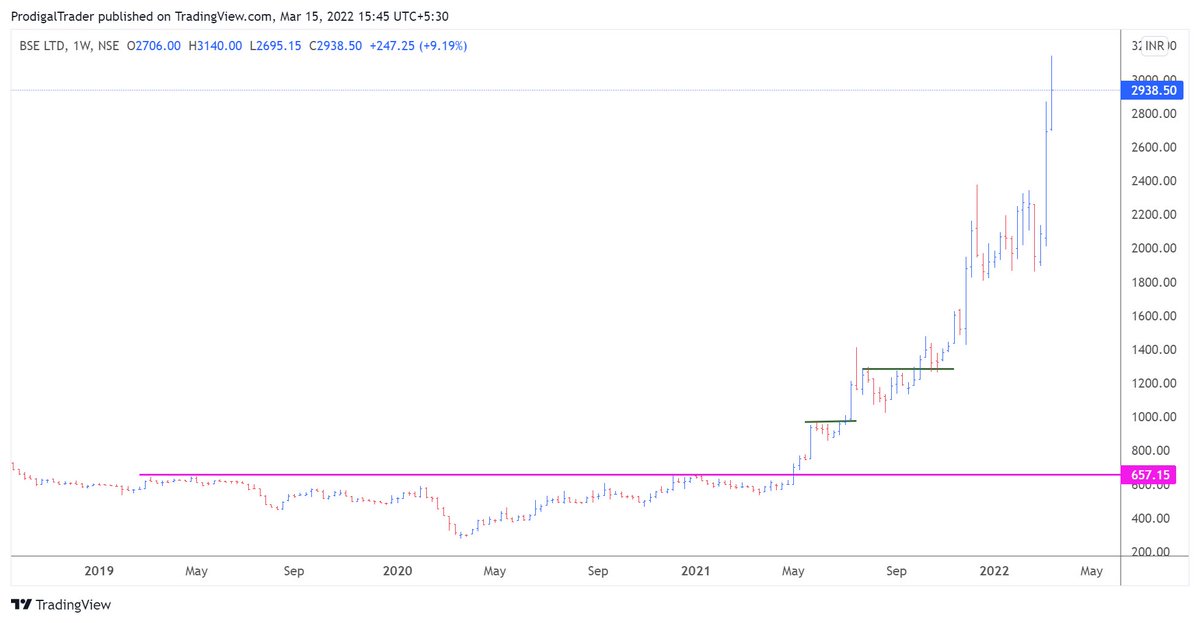


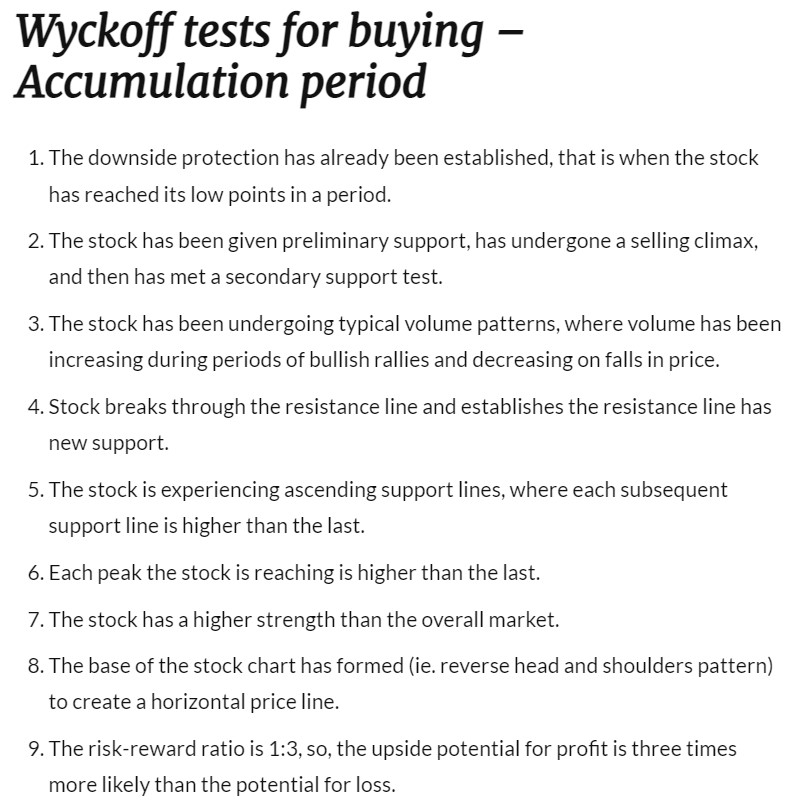
More pointers to help in identifying whether its accumulation or Distribution.
Lest some charlie jumps to point out, let me make it clear that I haven't invented anything in stock market, all my knowledge of stock market comes from old farts. Just my observation is my own. https://t.co/uHNw8tV4AO
Lest some charlie jumps to point out, let me make it clear that I haven't invented anything in stock market, all my knowledge of stock market comes from old farts. Just my observation is my own. https://t.co/uHNw8tV4AO
Plz advice how to identify accumulation and distribution phase...... to me Both looks same
— VIVEK VAID (@bobvaid) February 12, 2022


Blue line(13Sma)moves below Red line(26Sma), SELL triggers
Only 2 signals - Buy & Sell
There is no stop loss in this system.
There could be some wild swings in prices like on "Budget Day" - In such a scenario, Keep 30 - 50 points below 21Sma to avoid big DD
It's a SAR system
Only 2 signals - Buy & Sell
There is no stop loss in this system.
There could be some wild swings in prices like on "Budget Day" - In such a scenario, Keep 30 - 50 points below 21Sma to avoid big DD
It's a SAR system
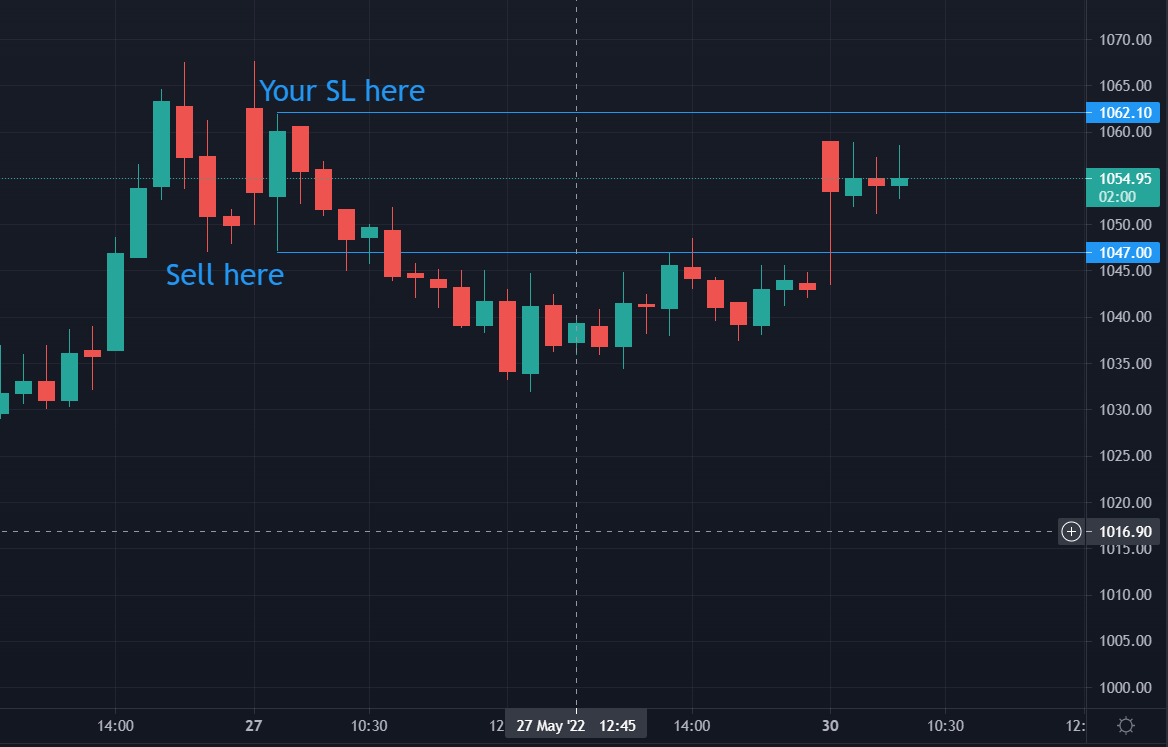
how to take stop loss..? low of prev candle?
— ABHINAV JAIN (@abhijain017) February 9, 2022